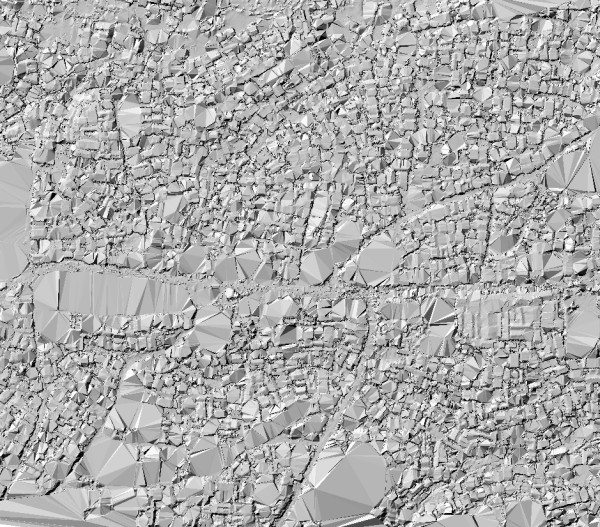
Tim Sutton and his team at Kartoza work on flood modelling and risk assessment using Inasafe. They have been trying to generate a DTM from point cloud data derived via dense-matching from UAV imagery collected by an eBee of SenseFly in the „unplanned developments“ or „slums“ North West of Dar es Salaam, the capital city of Tanzania. Tim’s team was stuck after „other software“ produced this result:
Tim reached out to us at rapidlasso asking whether LAStools could handle this better. After all, we had published two blog articles – namely this one and that one – showing how to generate DTMs from the point clouds generated by the dense-matching photogrammetry software of Pix4D. Below the workflow we devised and the results we produced for Tim and his team.
We obtained 3 different data sets of areas called „Tandale“, „Borahatward“, and „Bugurunni“. We added one new option to our lasground software called ‚-bulge 1.0‘ (see README) to improve the removal of smaller buildings and got this result for „Tandale“.
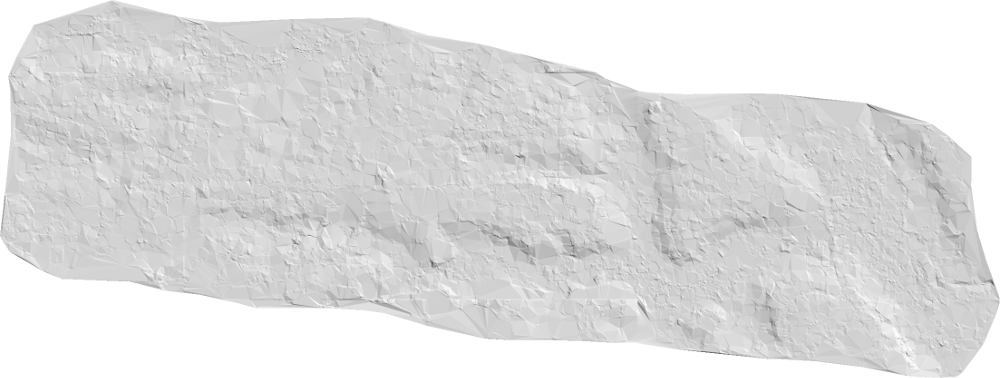
Before you point out the „facetted“ look of this DTM keep in mind that „Tandale“ is a densely populated poor area. A first hand account of the rough life in this area can be found here. Most dense-matching points are on corrugated roofs that become voids that need to be interpolated across in the DTM. Take a look at the corresponding DSM where all objects are still present.
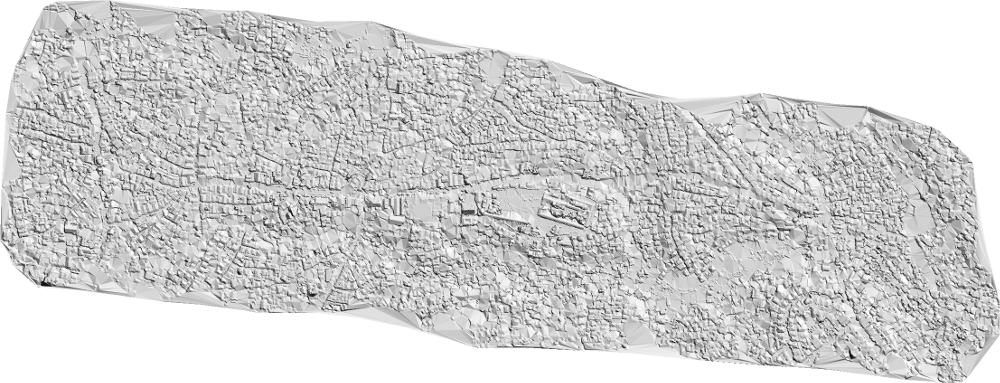
Below we give a detailed description at the example of the „Bugurunni“ data set of the workflow that was used to generate DTMs for the three data sets. At the end of this article you will see some more results.
We first use lassort to quantize, sort, and compress on 4 cores the seven spatially incoherent LAS files of the „Bugurunni“ data set (totalling 4.5 GB with excessive resolution of millimeters) into LASzip-compressed files with a more reasonable resolution of centimeters and points ordered along a space-filling curve. We also add the missing projection information with ‚-utm 37M‘. The resulting 7 LAZ files occupy only 0.7 GB meaning we get a compression of 9 : 1. The option ‚-odir‘ specifies the output directory.
lassort -i bugurunni_densified_*.las ^
        -rescale 0.01 0.01 0.01 ^
        -utm 37M ^
        -odir bugurunni_strips -olaz ^
        -cores 4
Next we tile the sorted strips into 500 meter by 500 meter tiles with 50 meter buffer using lastile. We use the new option ‚-flag_as_withheld‘ to mark all buffer points with the withheld flag so they can easily be removed on-the-fly with the ‚-drop_withheld‘ command-line filter (see the README file for more on this).
lastile -i bugurunni_strips\*.laz ^
        -files_are_flightlines ^
        -tile_size 500 -buffer 50 ^
        -flag_as_withheld ^
        -o bugurunni_raw\bugu.laz
lasnoise -i bugurunni_raw\*.laz ^
         -step_xy 2 -step_z 1 ^
         -isolated 15 ^
         -odir bugurunni_noise -olaz ^
         -cores 4
lasground -i bugurunni_noise\*.laz ^
          -ignore_class 7 ^
          -metro -bulge 1.0 ^
          -odir bugurunni_ground -olaz ^
          -cores 4
las2dem -i bugurunni_ground\*.laz ^
        -keep_class 2 ^
        -step 0.5 -kill 200 -use_tile_bb ^
        -odir bugurunni_dtm -obil ^
        -cores 4
lasgrid -i bugurunni_dtm\*.bil -merged ^
        -step 1.0 -average ^
        -o bugurunni_dtm.bil
Finally we create a hillshade of the DTM adding back the projection that was „lost“ in the BIL file generation so that blast2dem – the extremely scalable BLAST version of las2dem – can automatically produce a KML file for display in Google Earth.
blast2dem -i bugurunni_dtm.bil ^
          -hillshade -utm 37M ^
          -o bugurunni_dtm_hill.png
For comparison we also create a DSM with the same three steps but using all points.
las2dem -i bugurunni_raw\*.laz ^
        -step 0.5 -kill 200 -use_tile_bb ^
        -odir bugurunni_dsm -obil ^
        -cores 4
lasgrid -i bugurunni_dsm\*.bil -merged ^
        -step 1.0 -average ^
        -o bugurunni_dsm.bil
blast2dem -i bugurunni_dsm.bil ^
          -hillshade -utm 37M ^
          -o bugurunni_dsm_hill.png
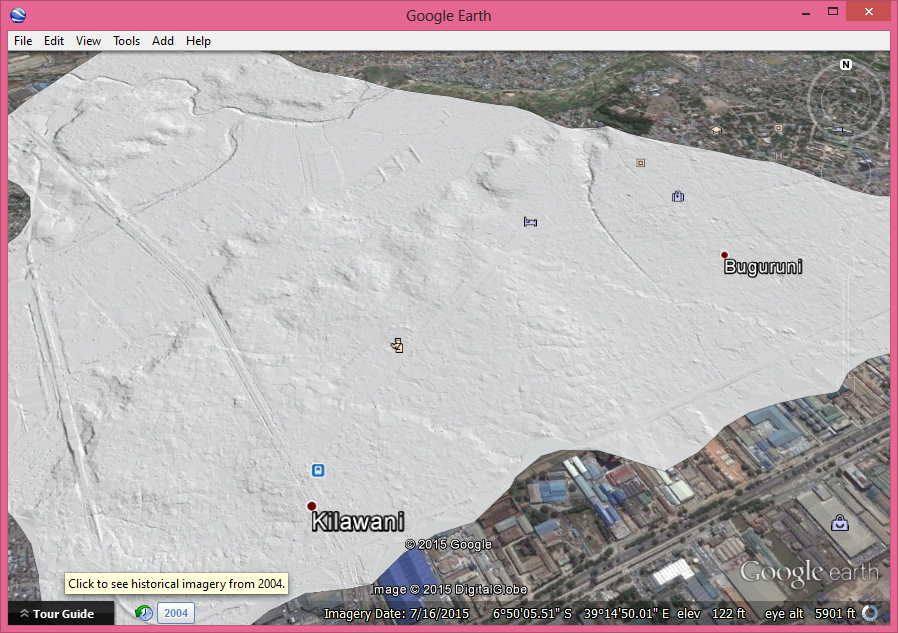
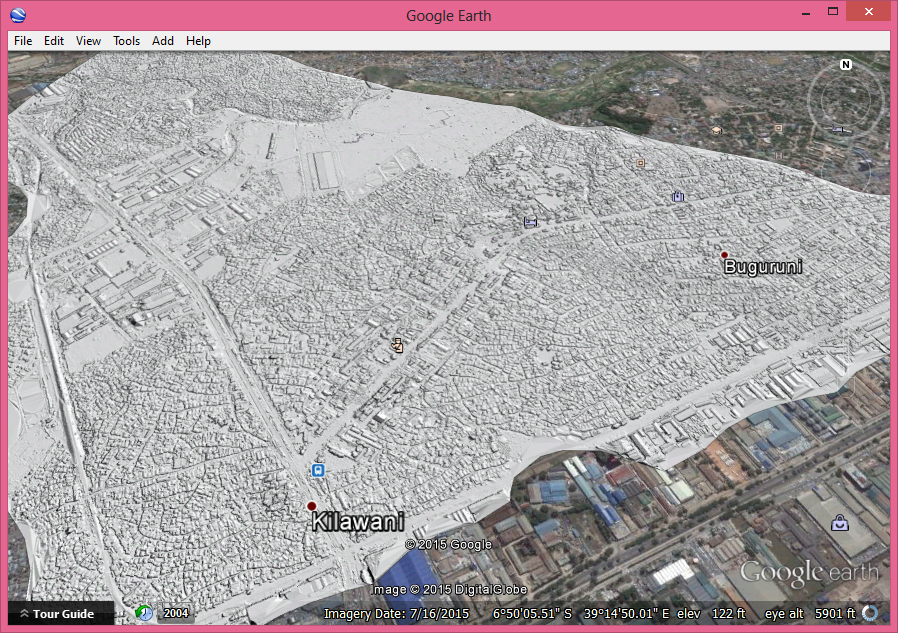
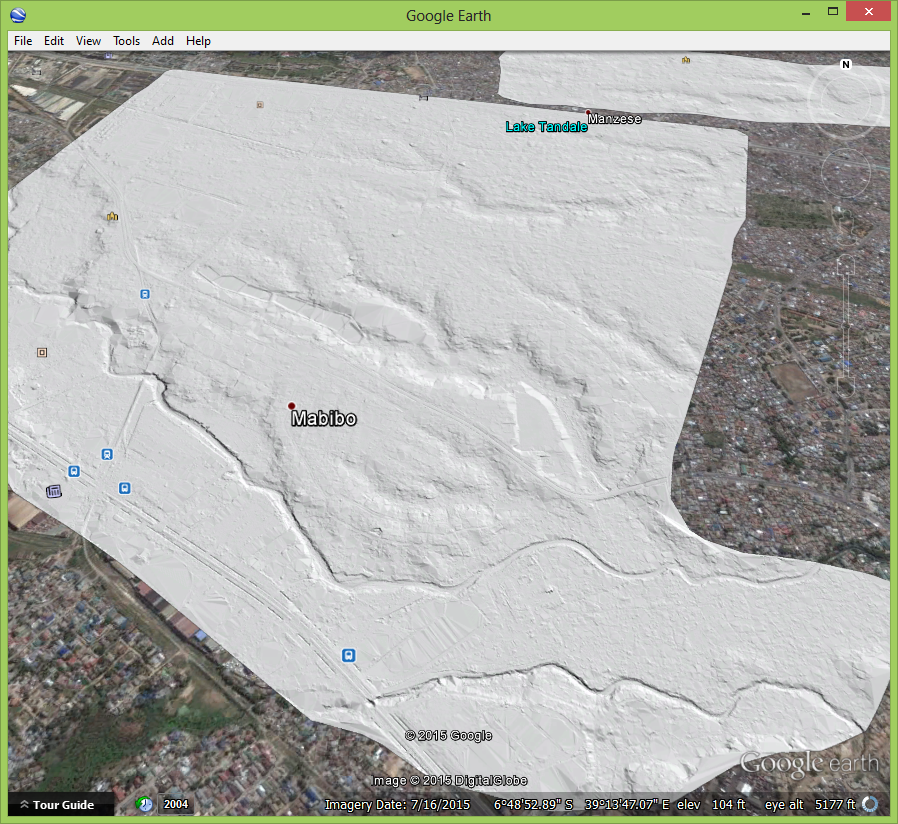
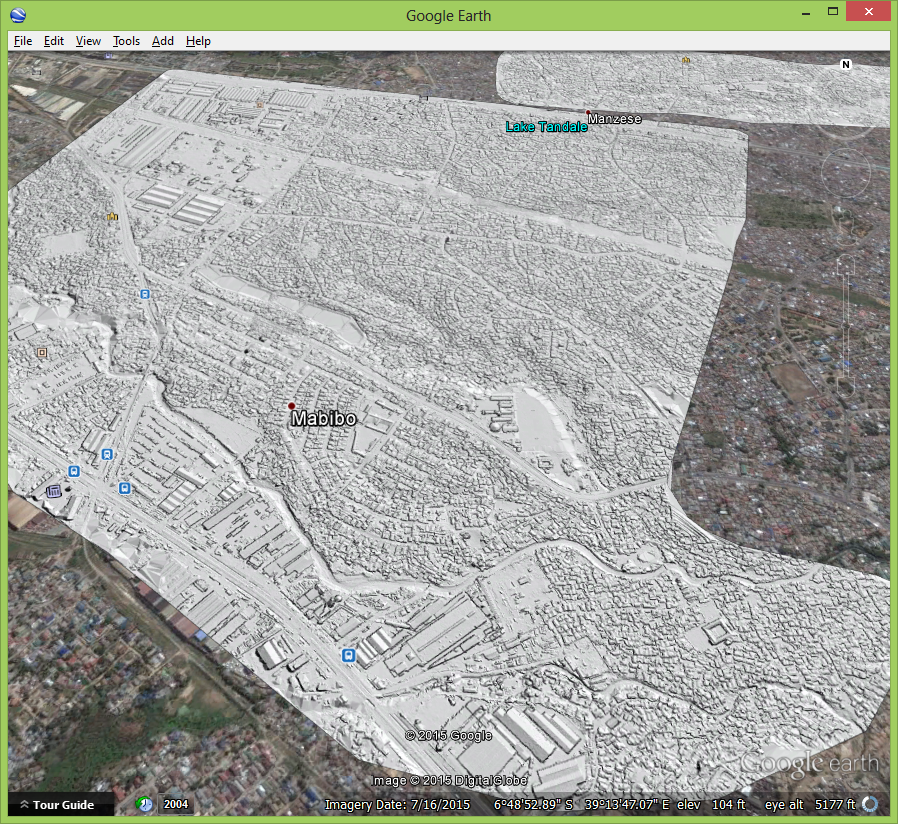
Above you see the generated DTM and below the corresponding DSM. So yes, LAStools can create DTMs from points that are result of dense-matching photogrammetry … under one assumption: there is not too much vegetation.
Below also the results for the „Borahatward“ data. In a future blog post we will see how to deal with the excessive low noise sometimes present in dense-matching points.

This is a very interesting and nice job. I have a similar issue. I have around 200 pictures of ice sheet (with lat/long and z values taken from GPS for each pictures). I generated a dense point cloud using a software but end-up with points classified as ground only. The pictures show only ice sheet on a surface with all its details such as cracks, small gullies, shallow lakes or rivers. I am frustrated as I am hoping to do terrain analysis, such as extracting the gullies, knowing the depth of rivers, ice height and volume, identify cracks etc. Can I adopt this approach to better create a DTM and DSM from my ice sheet pictures? I am a student, who is also a very beginner of lastool user. May I have your complete codes for the entire workflow of this excellent job? Thank you very much.
Pingback: Removing low noise from Semi-Global Matching (SGM) Points | rapidlasso GmbH
Pingback: Creating a Better DTM from Photogrammetic Points by Avoiding Shadows | rapidlasso GmbH
Pingback: LASmoons: Stéphane Henriod | rapidlasso GmbH
Pingback: FANR5640/7640: LAStools2 – GIS Note
Pingback: Integrating External Ground Points in Forests to Improve DTM from Dense-Matching Photogrammetry | rapidlasso GmbH
Pingback: Removing Excessive Low Noise from Dense-Matching Point Clouds | rapidlasso GmbH
Pingback: Digital Pothole Removal: Clean Road Surface from Noisy Pix4D Point Cloud | rapidlasso GmbH