I came across an interesting blog article by Jarlath O’Neil-Dunne from the University of Vermont on how LiDAR return information can be used as a simple way to discriminate vegetated areas from buildings. He first computes a normalized first-return DSM and a normalized last-return DSM that he subtracts from another to highlight the vegetation. He writes „This is because the height difference of the first and last returns for buildings is often identical, whereas for trees it is typically much greater.“
Side note: I am not entirely happy with the terminology of a „Normalized Digital Terrain Model (nDTM)“. Jarlath writes: „A similar approach is used to create a Normalized Digital Terrain Model (nDTM). A DTM is generated from the last returns. The DEM is then subtracted from the DTM to create the nDTM.“ I like to reserve the term „Digital Terrain Model (DTM)“ for bare-earth terrain computed from returns classified as ground.
Below I radically simplify Jarlath workflow by eliminating the two normalization steps. This not only saves the creation of 3 temporary rasters but also removes the requirement to have ground-classified LiDAR:
- Create a first-return frDSM
- Create a last-return lrDSM
- Subtract the lrDSM from the frDSM to get a return-difference rdDEM
This rdDEM has non-zero heights in all areas where the LiDAR produced more than one return. This happens most often and most pronounced in vegetated areas. Here is how to implement this with las2dem of LAStools:
las2dem -i ..\data\fusa.laz -first_only -o frDSM.bil
las2dem -i ..\data\fusa.laz -last_only -o lrDSM.bil
lasdiff -i frDSM.bil -i lrDSM.bil -o rdDEM.laz
lasview -i rdDEM.laz
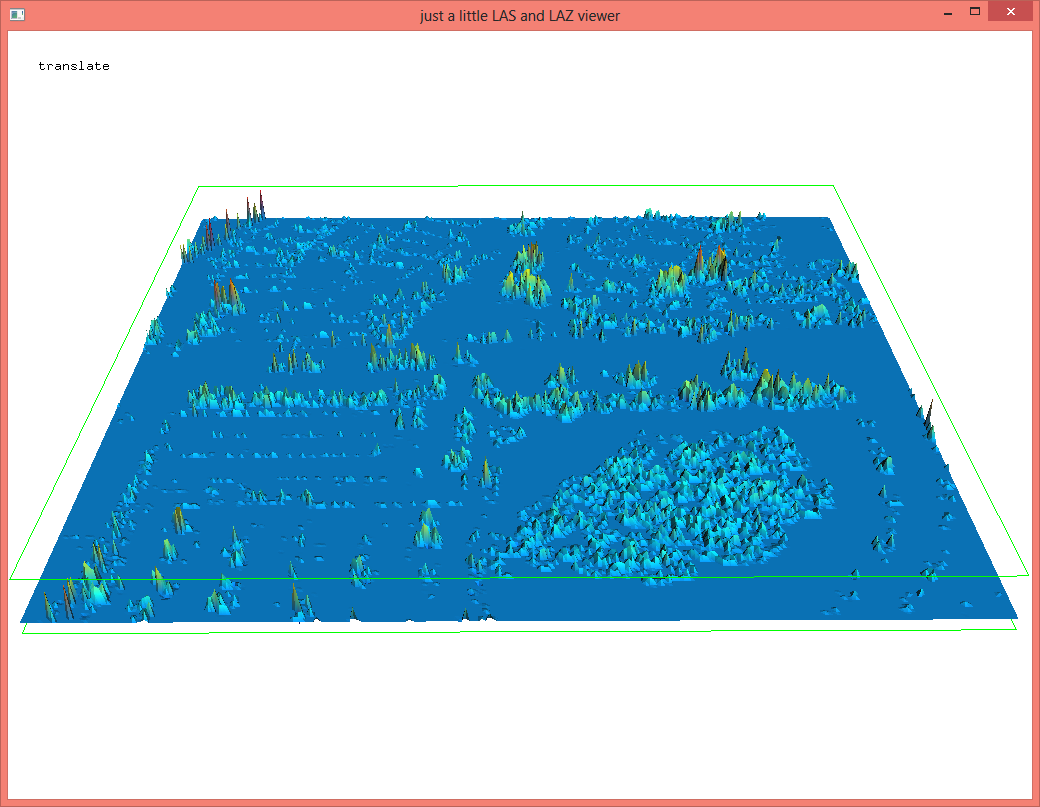
Does this work well for you? The results on the „fusa.laz“ data set are not entirely convincing … maybe because the vegetation was too dense (leaf-on?) so that the LiDAR penetration is not as pronounced. You can switch back and forth between the first-return and the last-return DSM by loading both *.bil files into lasview with the ‚-files_are_flightlines‘ option and then press hotkeys ‚0‘ and ‚1‘ to toggle between the points and ‚t‘ to triangulate the selected DSM.
lasview -i frDSM.bil lrDSM.bil -files_are_flightlines
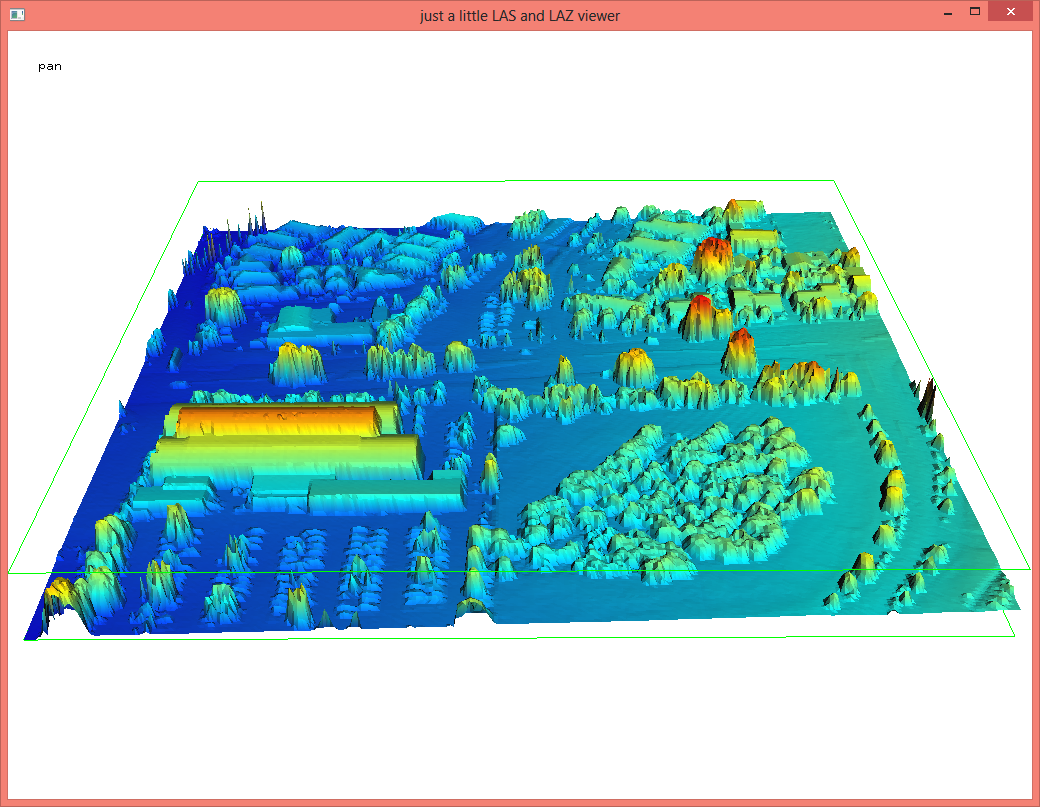
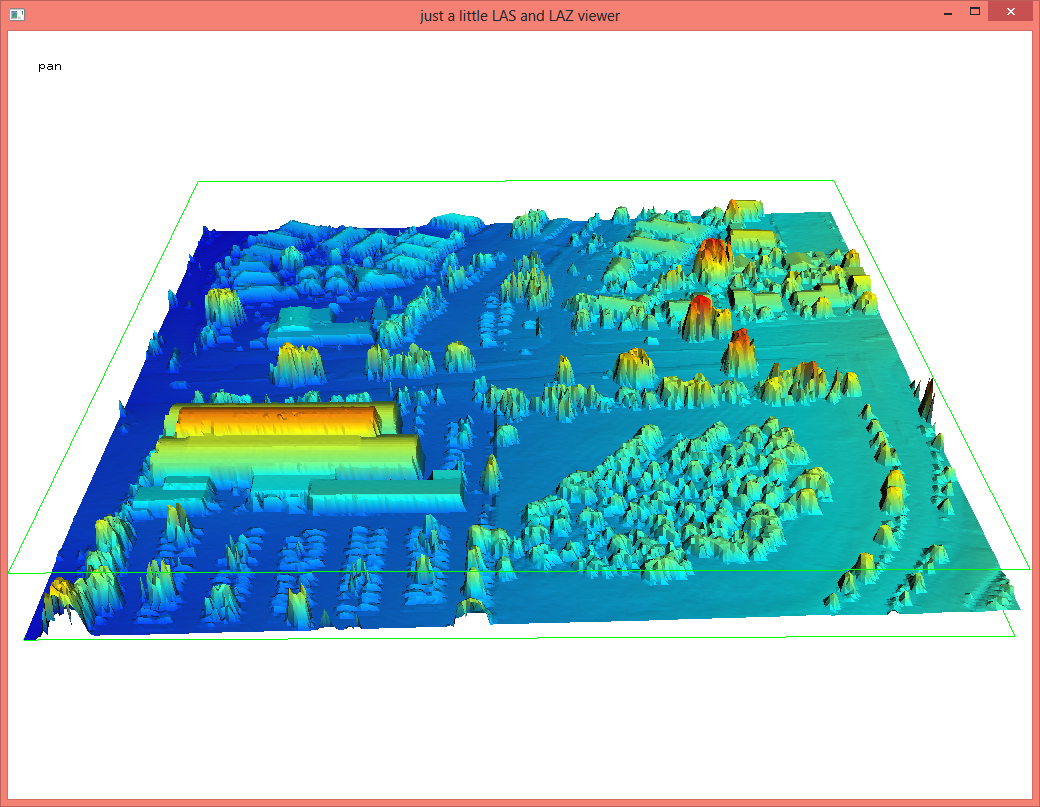
We should point out that for Jarlath the return difference raster rdDEM is just one part of the pipeline that is followed by an object-based approach in which they integrate the spectral information from aerial imagery and then use iterative expert systems to further improve the tree canopy classification.
Nevertheless, we believe that our way of classifying vegetation and buildings via a pipeline of lasground, lasheight, and lasclassify gives a better and more robust initial guess than multi-return height differences towards what is vegetation and what are buildings. Below you see this is implemented using the new LASlayers concept:
lasground -i ..\data\fusa.laz -city -extra_fine -olay
lasheight  -i ..\data\fusa.laz -ilay -olay
lasclassify -i ..\data\fusa.laz -ilay -olay
lasview -i ..\data\fusa.laz -ilay

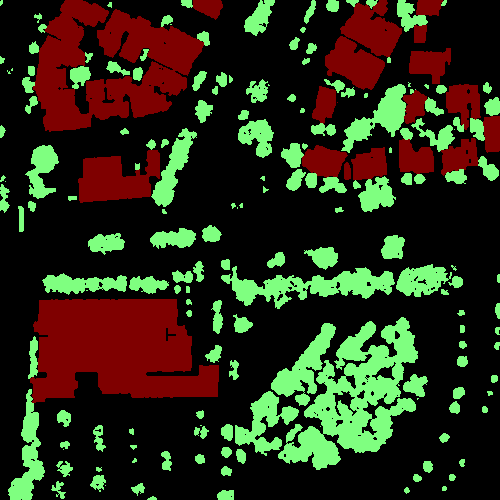
Using lasgrid there are many ways that can easily turn the classified point cloud into a raster so that it can be used for subsequent exploitation together with other image data using a raster processing software. An example is shown below.
lasgrid -i ..\data\fusa.laz -ilay -keep_class 5 ^
        -step 0.5 -subcircle 0.1 -occupancy -fill 1 -false ^
        -use_bb -o vegetation.tif
lasgrid -i ..\data\fusa.laz -ilay -keep_class 6 ^
        -step 0.5 -subcircle 0.1 -occupancy -fill 1 -gray ^
        -use_bb -o buildings.tif
gdalwarp vegetation.tif buildings.tif classified.tif
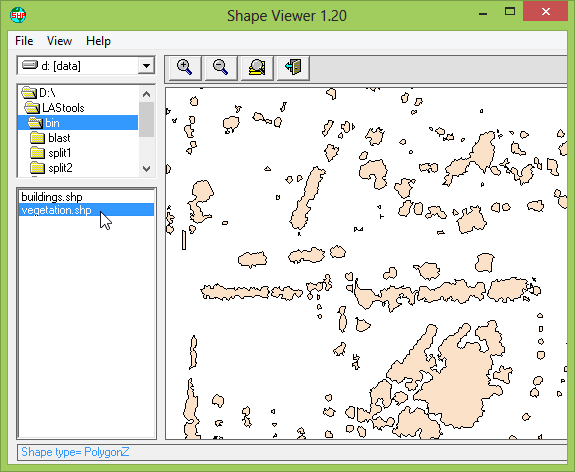
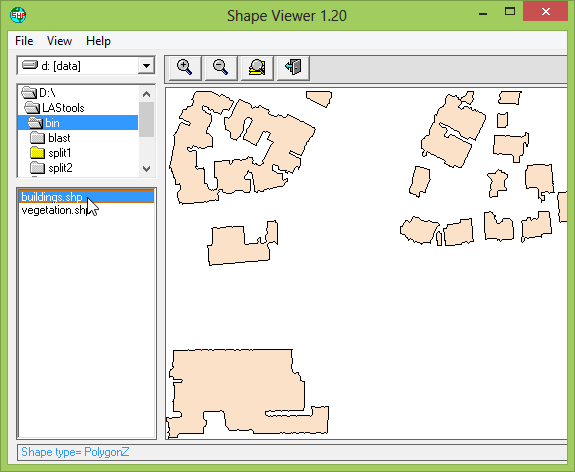
Alternatively we can use lasboundary to create a shapefile describing either the vegetation or the buildings.
lasboundary -i ..\data\fusa.laz -ilay -keep_class 5 ^
            -disjoint -concavity 1.5 -o vegetation.shp
lasboundary -i ..\data\fusa.laz -ilay -keep_class 6 ^
            -disjoint -concavity 1.5 -o buildings.shp

1) Would be nice to have some sort of standard naming convention for surface models. DTM in particular is problematic. I like your suggestions better but was a bit confused what was meant by rdDEM.
2) Great example of the power of lasclassify!
3) Our desired end state is to have a representation of canopy in either raster or vector form so that the area of canopy can we quantified. Classifying the LiDAR points, while valuable for many applications, does not provide us with what we need, which is why we focus on objects. For a strict point cloud classification LAStools is the way to go.
Jarlath, do you have a better suggestion for the naming of what I have (temporarily) called „return difference DEM“ aka rdDEM? Maybe „multi return height difference DEM“ aka mrhdDEM? (-: I have updated the blog with two more steps that use lasgrid and lasboundary to turn the classified point clouds into either raster or vector form so you can either improve it further using aligned raster imagery or directly compute roof and canopy areas in a post-processing step.
I would like to know more about the „-occupancy“, „-subcircle“, and „-false“ command line arguments. The lasgrid_readme.txt doesn’t mention them.
I don’t have a better suggestion, but wish we did have some sort of industry standard for all of these various layers! We use our naming conventions more out of habit than anything else. I know some people (mainly defense) who use „DEM“ to describe any surface model.
Object-based approaches have key advantages in dealing with gaps in LiDAR (due to leaf-off) and morphological operations to make things look good (which is how people often judge out data), but this gets me thinking that running lasclassify, then populating that information into the object would likely yield superior results to what we have been doing. Time to test things out. Thanks for this great post!
Martin, Jarlath,
I use an eCognition (trial version) classification approach on 50cm (RGB-NIR) orthophoto imagery, using raterized lasclassify results (relative building and tree heights rasters) as additional input.
As you pointed out, Jarlath, the object-based approach works well filling the gaps left from the Lidar classification. While the approach works well for me basically, it could be even better if I had imagery and Lidar data that were collected at the same time over the area I use. But since this is for a proof-of-concept lab exercise, it doesn’t have to be perfect.
I’d be happy to share a few screenshots, but can’t seem to include any here.
Hi Martin,
I looked at my classification mentioned in my previous comment and noticed some of the improvements as well as additional misclassifications that adding spectral information causes.
I’m wondering if you have looked into improving lasclassify by incorporating RGB values, or rather instead of RGB values NDVI or at least NIR values to better discriminate between buildings and trees, when the -planar option cannot catch everything.
With Lidar data coming in ‚richer‘ formats (e.g. RGB values etc.) that might be an area worth looking into. Any thoughts?
Dear martin isenburg , It is very helpful. It would be more flexible if you could provide video tutorial of this type of specific problem.
Looking forward to your new tutorials.
Thanks