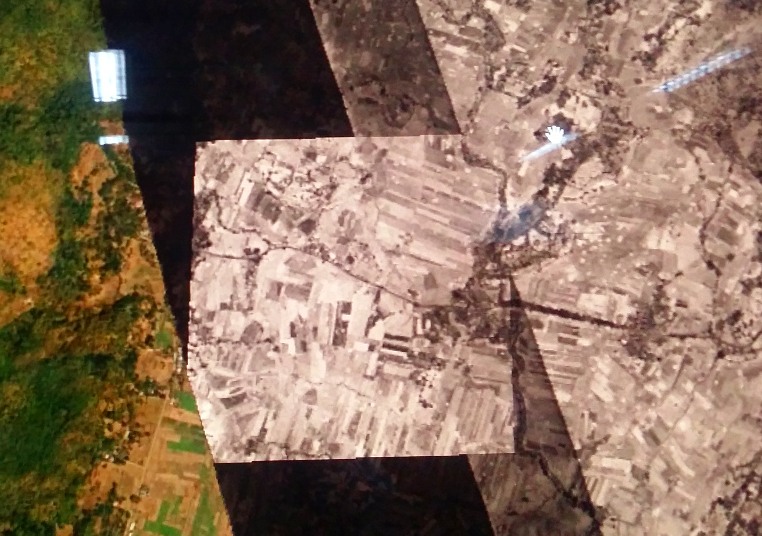
Visiting our users on-site, such as last week at Mariano Marcos State University in Ilocos Norte in the Philippines, we sometimes come across situations as pictured below where the intensity values of the returns of one flightline are drastically different from that of other flightlines.

Using intensity rasters with such dark strips as an additional input for land cover classification may likely make things worse. Radiometrically „correct“ intensity calibration is a complex topic and may not always be possible to do using only the LAZ files without meta information such as the internals of the scanning system and the aircraft trajectory. However, we now describe a „quick and dirty“ fix to the situation shown above so that the intensity grids (that were computed as averages of first return intensities) at least „look“ as sensible as for the one square tile (shown below) that was corrected by a simple multiplication with 5 for all intensities of the dark strip.

The number 5 was determined by a quick glance at the intensity histograms that we can generate with lasinfo. We decide to only look at single returns as we expect them to have a higher correlation: Their locations are more likely to be „seen similarly“ from and their energy is more likely „reflected similarly“ to different flightlines compared to that of multiple returns.
lasinfo -i strip1.laz strip2.laz strip3.laz ^
        -keep_single ^
        -histo intensity 1 ^
        -nmm -nh -nv ^
        -odix _histo_int -otxt
The resulting histograms for the dark ’strip1.laz‘ is quite different from that of the much brighter ’strip2.laz‘ and ’strip3.laz‘. The average single return intensity for the dark ’strip1.laz‘ is a meager 5.13 whereas the brighter ’strip2.laz‘ and ’strip3.laz‘ have similar averages of 24.15 and 24.50 respectively.
Draw your own conclusion about which scale factor to use. We have the choice to match either the peak of the histograms or their averages. Scaling the peak of 3 for ’strip1.laz‘ to match the 25 of the other two strips is too much of an upscaling. But the average 24.15 divided by 5.13 gives a potential scale of 4.71 and the average 24.50 divided by 5.13 gives a potential scale of 4.77 and we already saw a multiplication by 5 giving reasonable results. So this is how we can fix the intensity:
las2las -i strip1.laz ^
        -scale_intensity 4.75 ^
        -odix _corr_int -olaz
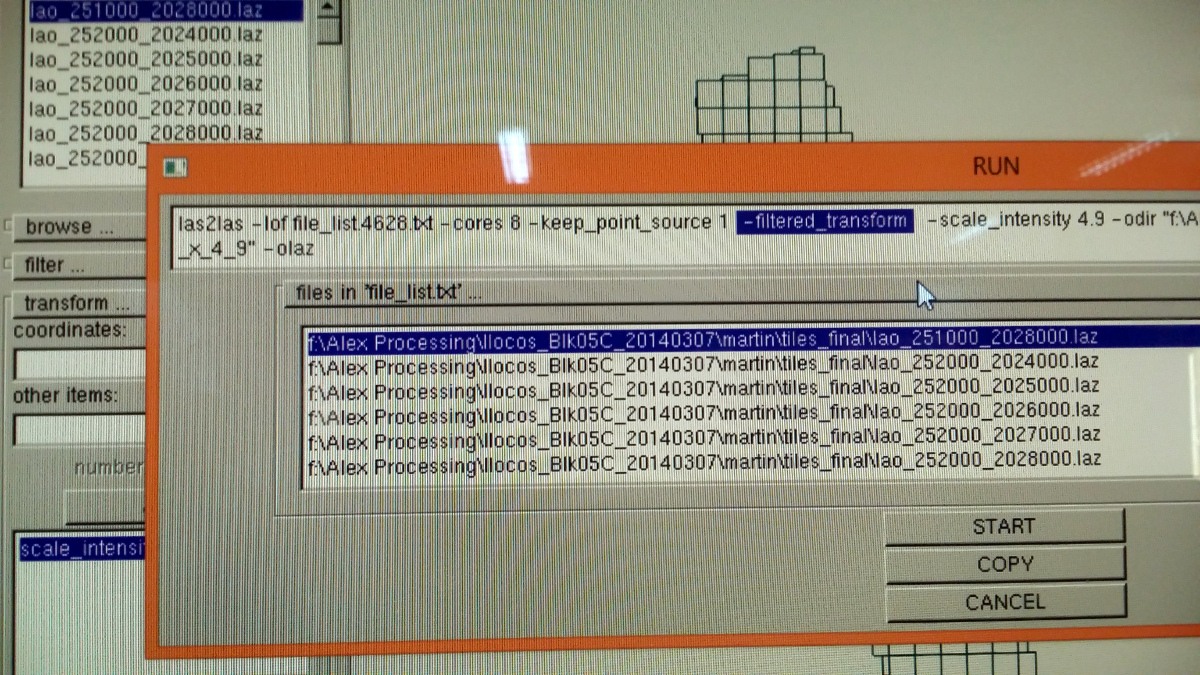
But what if your data is already in tiles? How can you adjust only the intensity of those returns that are from the flightline 1? Assuming that your flightline information is properly stored in the point source ID field of every point this is easily done with the new ‚-filtered_transform‘ in LAStools using las2las on as many cores as you have as follows:
las2las -i tiles/*.laz ^
        -keep_point_source 1 ^
        -filtered_transform ^
        -scale_intensity 4.75 ^
        -odir tiles_corr -olaz ^
        -cores 8
This is not currently exposed in the GUI of las2las but you can simply add it by typing it into the ‚RUN‘ pop-up window as shown below.

After this „quick and dirty“ intensity correction we again ran lasgrid as follows:
lasgrid -i tiles_corr/*.laz ^
        -gray -set_min_max 0 60 ^
        -odir tiles_int_rasters -opng ^
        -cores 8
And the result is shown below. The obvious flightline-induced discontinuity in the intensities has pretty much disappeared. Do you have similar flightline-related intensity issues? We like to hear from you whether this technique works or if we need to implement something more clever in the future …


