Jane Meiforth (recipient of three LASmoons)
Environmental Remote Sensing and Geoinformatics
University of Trier, GERMANY
Background:
The New Zealand Kauri trees (or Agathis australis) are under threat by the so called Kauri dieback disease. This disease is caused by a fungi like spore, which blocks the transport for nutrition and water in the trunk and finally kills the trees. Symptoms of the disease in the canopy like dropping of leaves and bare branches offer an opportunity for analysing the state of the disease by remote sensing. The study site covers three areas in the Waitakere Ranges, west of Auckland with Kauri trees in different growth and health classes.
Goal:
The main objective of this study is to identify Kauri trees and canopy symptoms of the disease by remote sensing, in order to support the monitoring of the disease. In the first step LAStools will be used to extract the tree crowns and describe their characteristics based on height metrics, shapes and intensity values from airborne LiDAR data. In the second step, the spectral characteristics of the tree crowns will be analyzed based on very high resolution satellite data (WV02 and WV03). Finally the best describing spatial and spectral parameters will be combined in an object based classification, in order to identify the Kauri trees and different states of the disease..
Data:
+ high resolution airborne LiDAR data (15-35p/sqm, ground classified) taken in January 2016
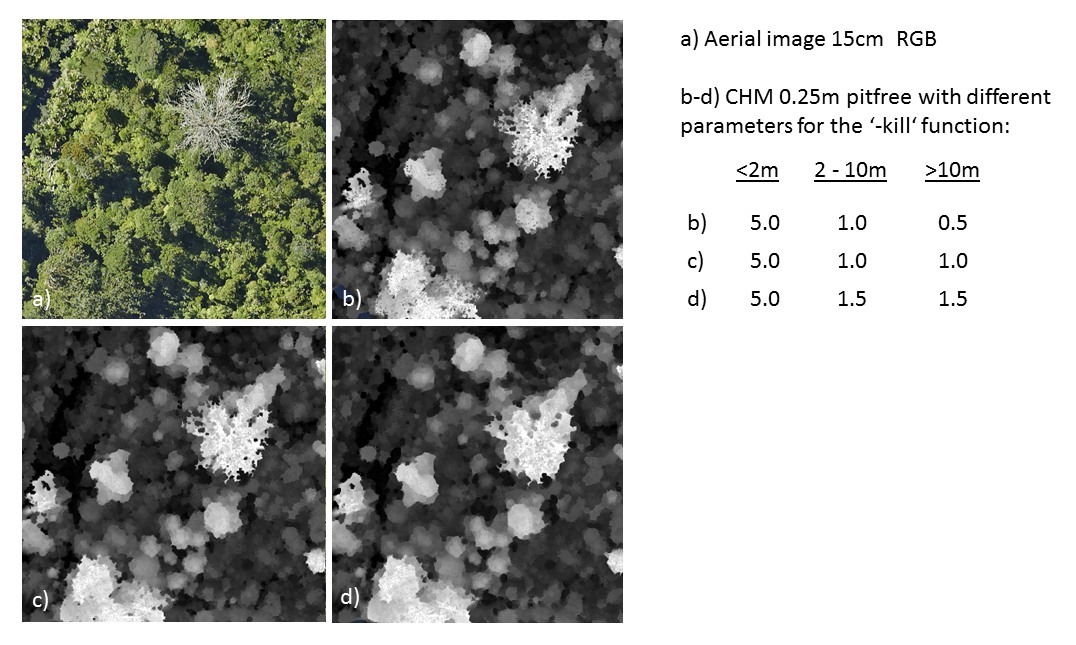
+ 15cm RGB aerial images taken on the same flight as the LIDAR data
+ ground truth field data from 2100 canopy trees in the study areas, recorded January – March 2016
+ helicopter images taken in January – April 2016 from selected Kauri trees by Auckland Council
+ vector layers with infrastructure data like roads and hiking tracks
LAStools processing:
1) create square tiles with edge length of 1000 m and a 25 m buffer to avoid edge artifacts [lastile]
2) generate DTMs and DSMs [las2dem]
3).produce height normalized tiles [lasheight]
4) generate a pit-free Canopy Height Model (CHM) using the method of Khosravipour et al. (2014) with the workflow described here [lasthin, las2dem, lasgrid]
5) extract crown polygons based on the pit-free CHM [inverse watershed method in GIS, las2iso]
6) normalize the points of each crown with constant ground elevation to avoid slope effects [lasclip, las2las with external source for the ground elevation]
7) derive height metrics for each crown on base of the normalized crown points [lascanopy]
8) derive intensity statistics for the crown points [lascanopy with ‚-int_avg‘, ‚-int_std‘ etc. on first returns]
9) derive metrics correlated with the dropping of leaves like canopy density, canopy cover and gap fraction for the crown points [lascanopy with ‚–cov‘, ‚–dns‘, ‚–gap‘, ‚–fraction‘]
Reference:
Hu B, Li J, Jing L, Judah A. Improving the efficiency and accuracy of individual tree crown delineation from high-density LiDAR data. International Journal of Applied Earth Observation and Geoinformation. 2014; 26: 145-55.
Khosravipour, A., Skidmore, A.K., Isenburg, M., Wang, T.J., Hussin, Y.A., 2014. Generating pit-free Canopy Height Models from Airborne LiDAR. PE&RS = Photogrammetric Engineering and Remote Sensing 80, 863-872.
Li J, Hu B, Noland TL. Classification of tree species based on structural features derived from high density LiDAR data. Agricultural and Forest Meteorology. 2013; 171-172: 104-14.
MPI New Zealand http://www.kauridieback.co.nz – website with information on the kauri dieback disease
Vauhkonen, J., Ene, L., Gupta, S., Heinzel, J., Holmgren, J., Pitkänen, J., Solberg, S., Wang, Y., Weinacker, H., Hauglin, K. M., Lien, V., Packalén, P., Gobakken, T., Koch, B., Næsset, E., Tokola, T. and Maltamo, M. (2012) Comparative testing of single-tree detection algorithms under different types of forest. Forestry, 85, 27-40.

Hello,
I understand that is not possible to extract tree crown using only LAStools, rather one needs to carry on extra analysis in a GIS
It would be great to have some extra details about the step 5. How the GIS-derived watershed results (Arcmap?) were integrated with the las2iso tool?
Thanks