My new favorite Swiss Miss, Viola Amherd, said today „Geodaten gehören heute zur Infrastruktur wie die Straßen und die Eisenbahn“, which says that „today, geodata are part of the infrastructure like roads and railways“. The federal councilor of Switzerland announced that programmers and planners, whether private or professional, can now download the data free of charge and use it for their projects. There are almost no limits to innovation for information projects.
Hello Germany? Hello Bavaria? Hello Austria? Where is your Open-Data-Autobahn? Whatever happened to unlimited speeds and endless Fahrvergnügen … (-;
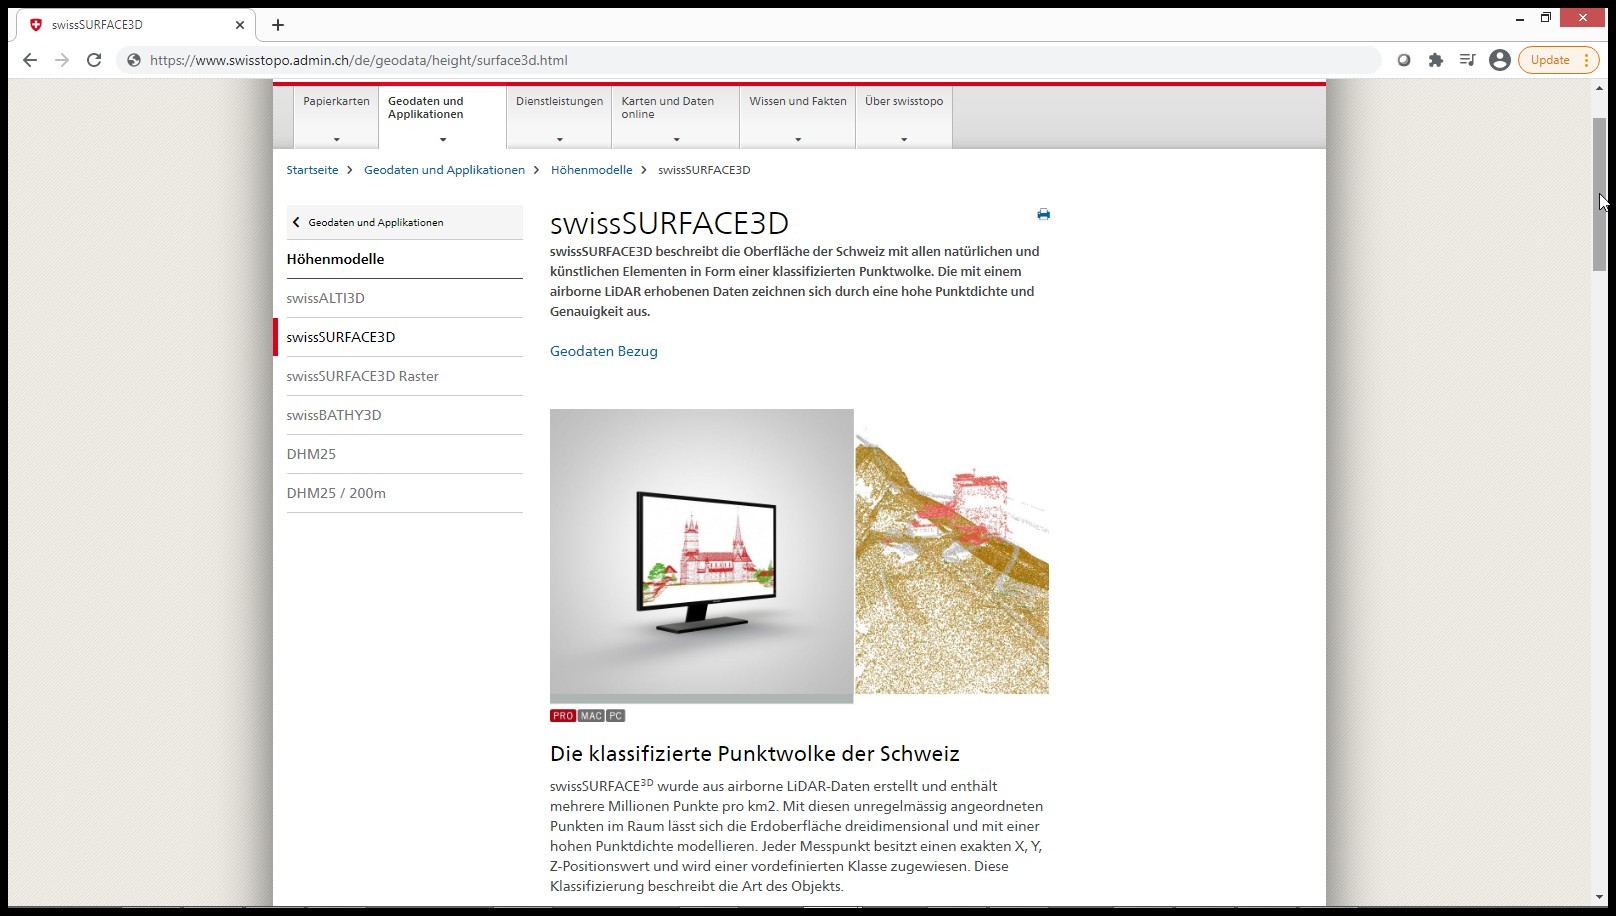
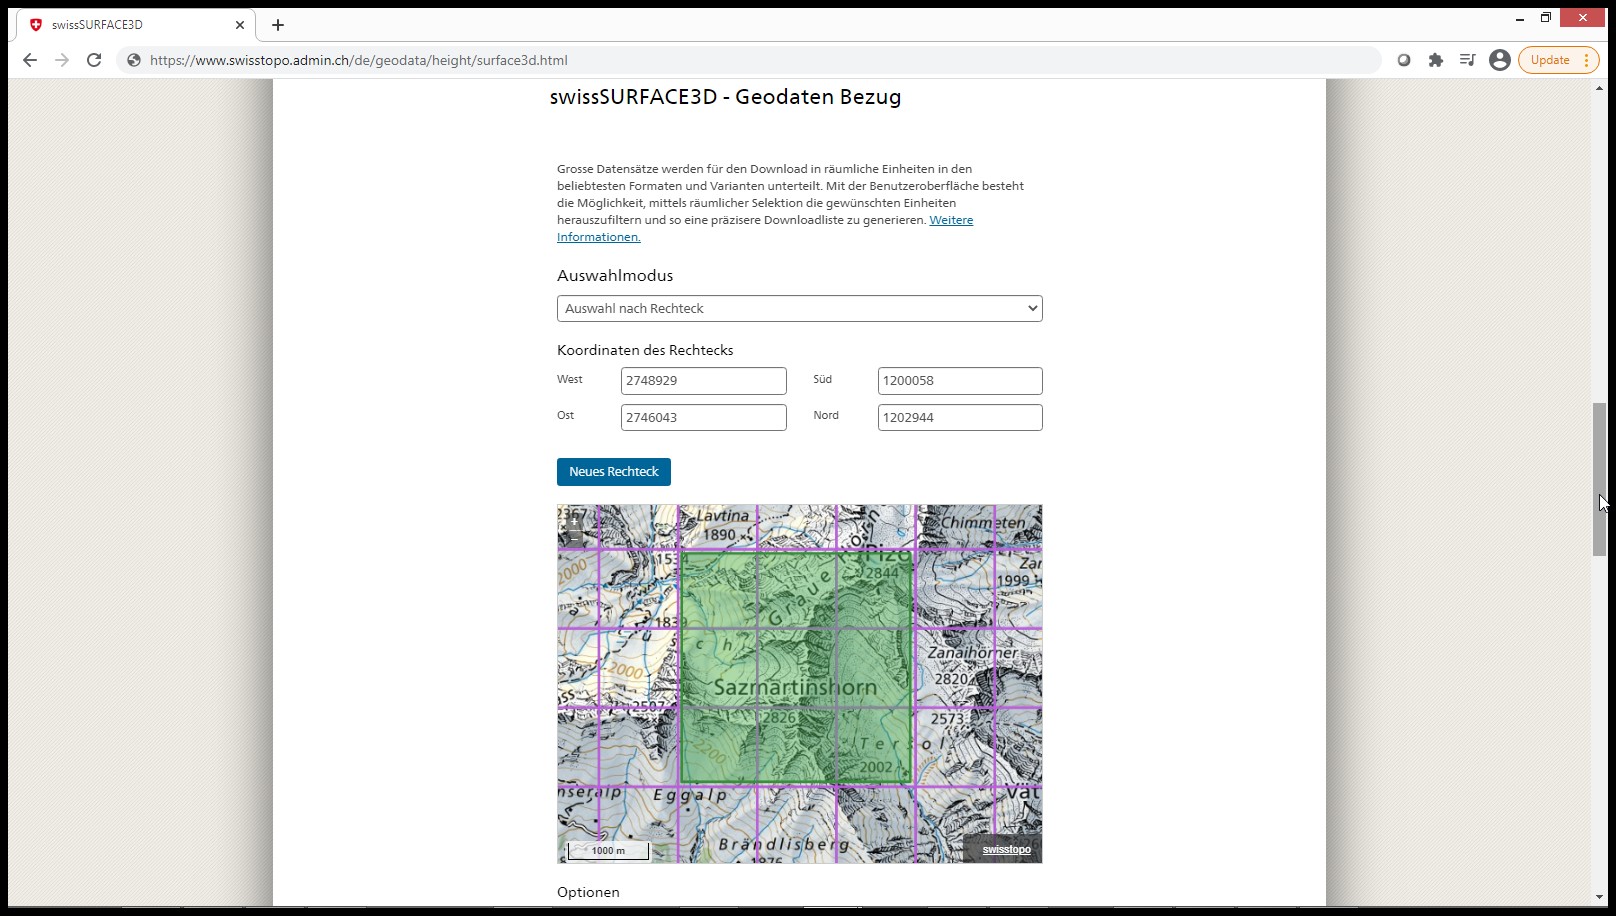
This means in Switzerland large amounts of LiDAR are now available for download from this portal here. There is amazing data there, including high-resolution ortho-photos and land cover data. However. we went straight for the LAS files and got ourselves a few tiles near the Sazmartinshorn in the example below.
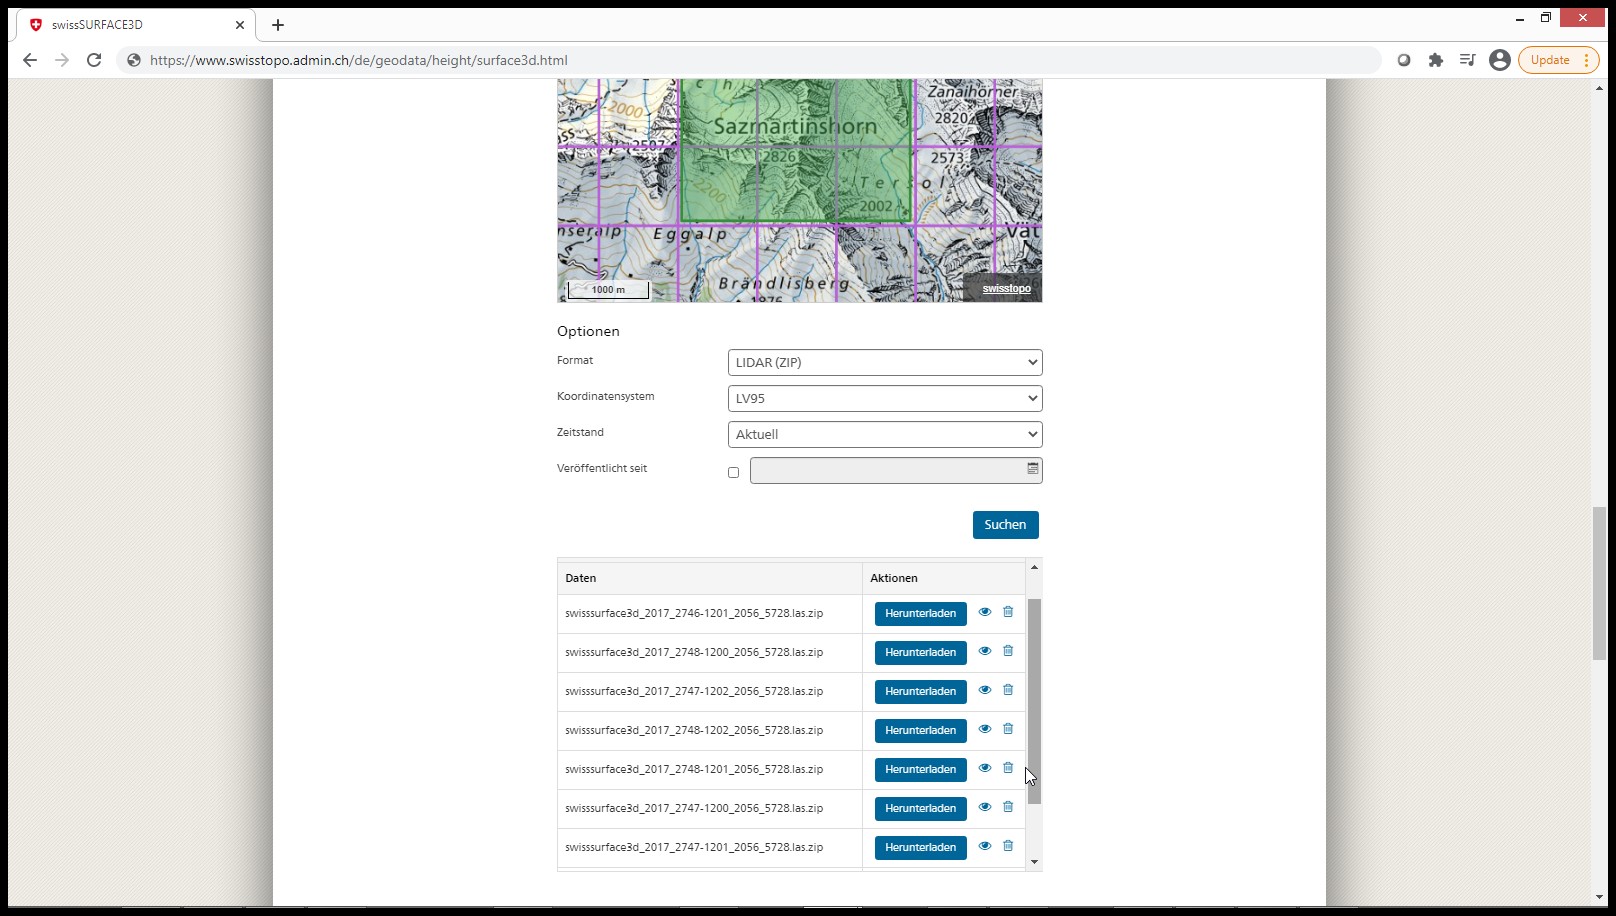
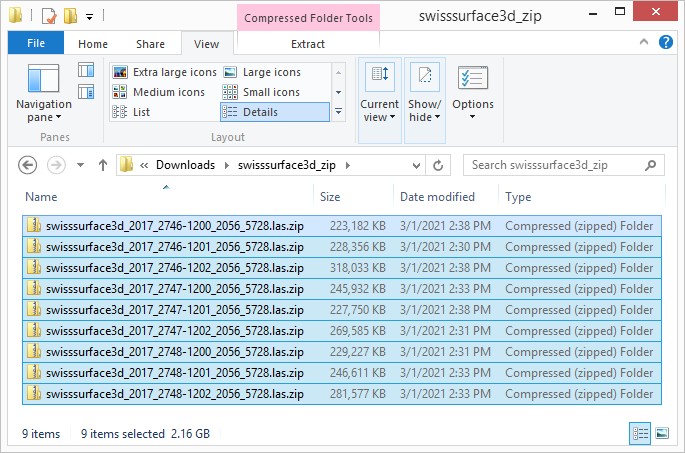
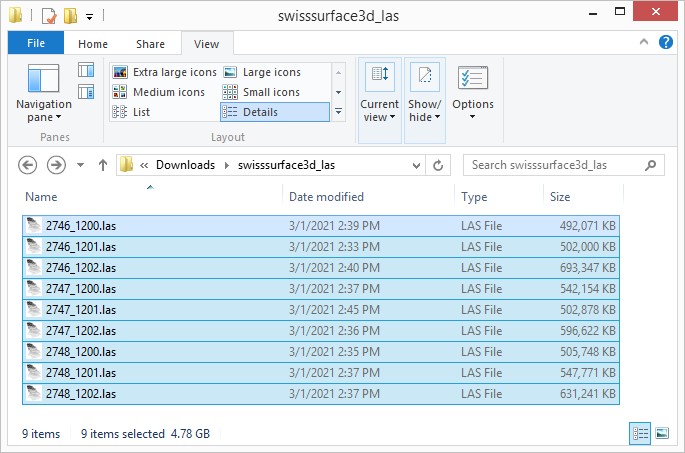
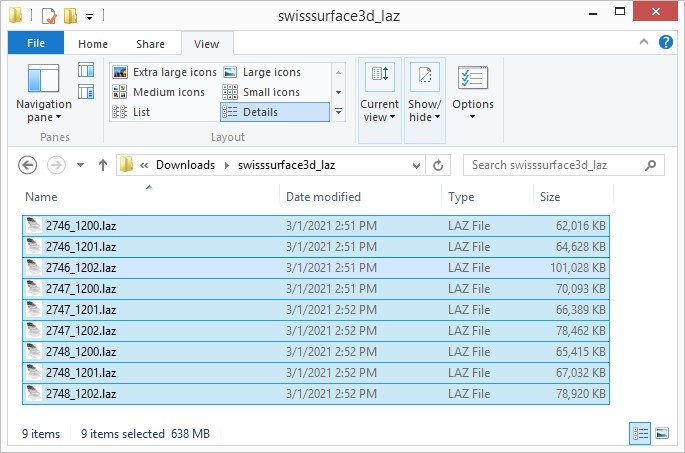
The tiles can be selected in a number of ways via an interactive map and come as individually zipped LAS files. We downloaded the nine tiles indicated above (2.16 GB), unzipped the bulky LAS files (4.78 GB) and compressed them to the compact LAZ format (638 MB) with laszip. Using LAZ instead of zipped LAS would lower storage size and transmission bandwidth by a factor of 3.5. Something the stereotypically frugal people of Switzerland may want to consider … (-;
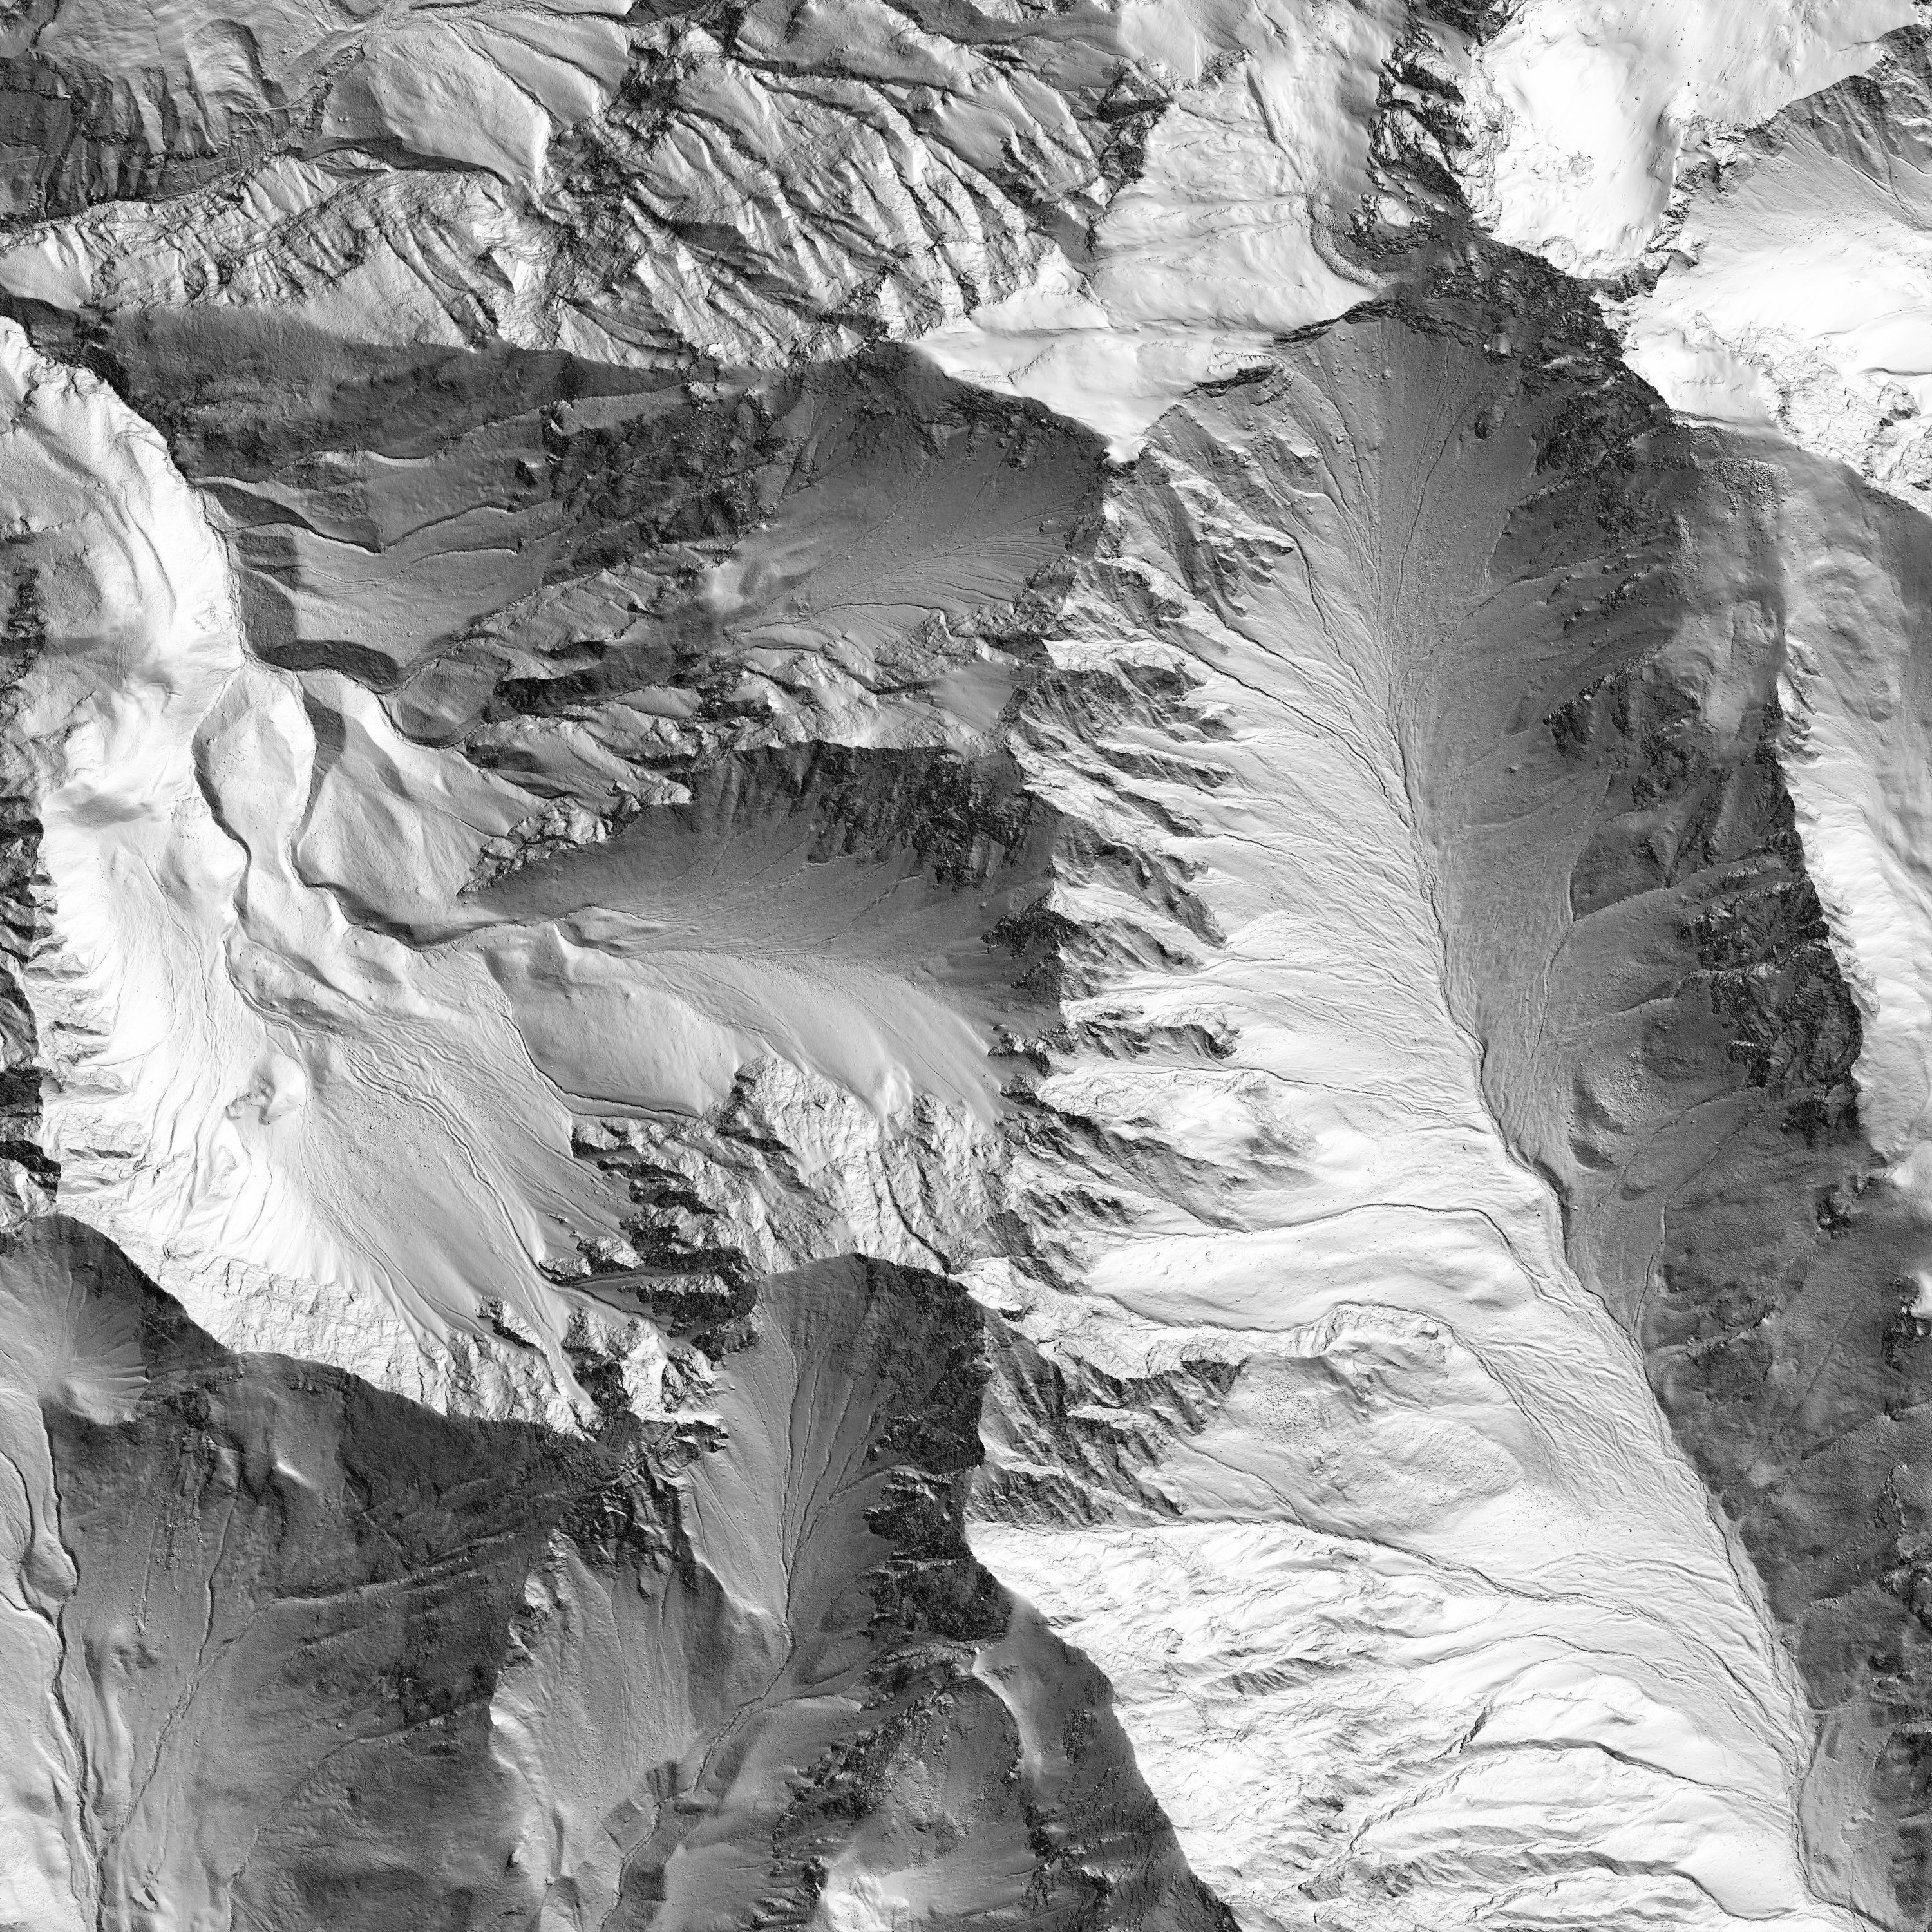
Then we process the data with a few typical command lines with the result shown below. The first uses blast2dem to create a hill shaded 1 meter DTM from the points classified as ground.
blast2dem ^-i swisssurface3d_laz\*.laz -merged ^-keep_class 2 -thin_with_grid 0.5 ^-step 1.0 -hillshade ^-o swiss_dtm_1m_hillshade.jpg
We use lasgrid to visualize the varying last return density per 2 meter by 2 meter area across the surveyed area with a false coloring that maps 10 or fewer pulses per square meter to blue and 20 or more pulses per square meters to red.
lasgrid ^-i swisssurface3d_laz\*.laz -merged ^-keep_last ^-step 2.0 ^-density ^-false -set_min_max 10 20 ^-o swiss_dendity_2m_10_20.jpg
A lasinfo report reveals that the scanner used was a RIEGL and the returning pulse width was quantized in tenths of a nanosecond into the user data field. We use lasgrid to visualize the range of the pulse width between 4.0 and 6.0 nanoseconds with a false coloring. Make sure to drop the points for which no pulse width was recorded (i.e. user data is zero) to avoid artifacts in the visualization.
lasgrid ^-i swisssurface3d_laz\*.laz -merged ^-drop_user_data 0 -keep_last ^-step 2.0 ^-user_data -lowest ^-false -set_min_max 40 60 ^-o swiss_pulsewidth_40_60.jpg
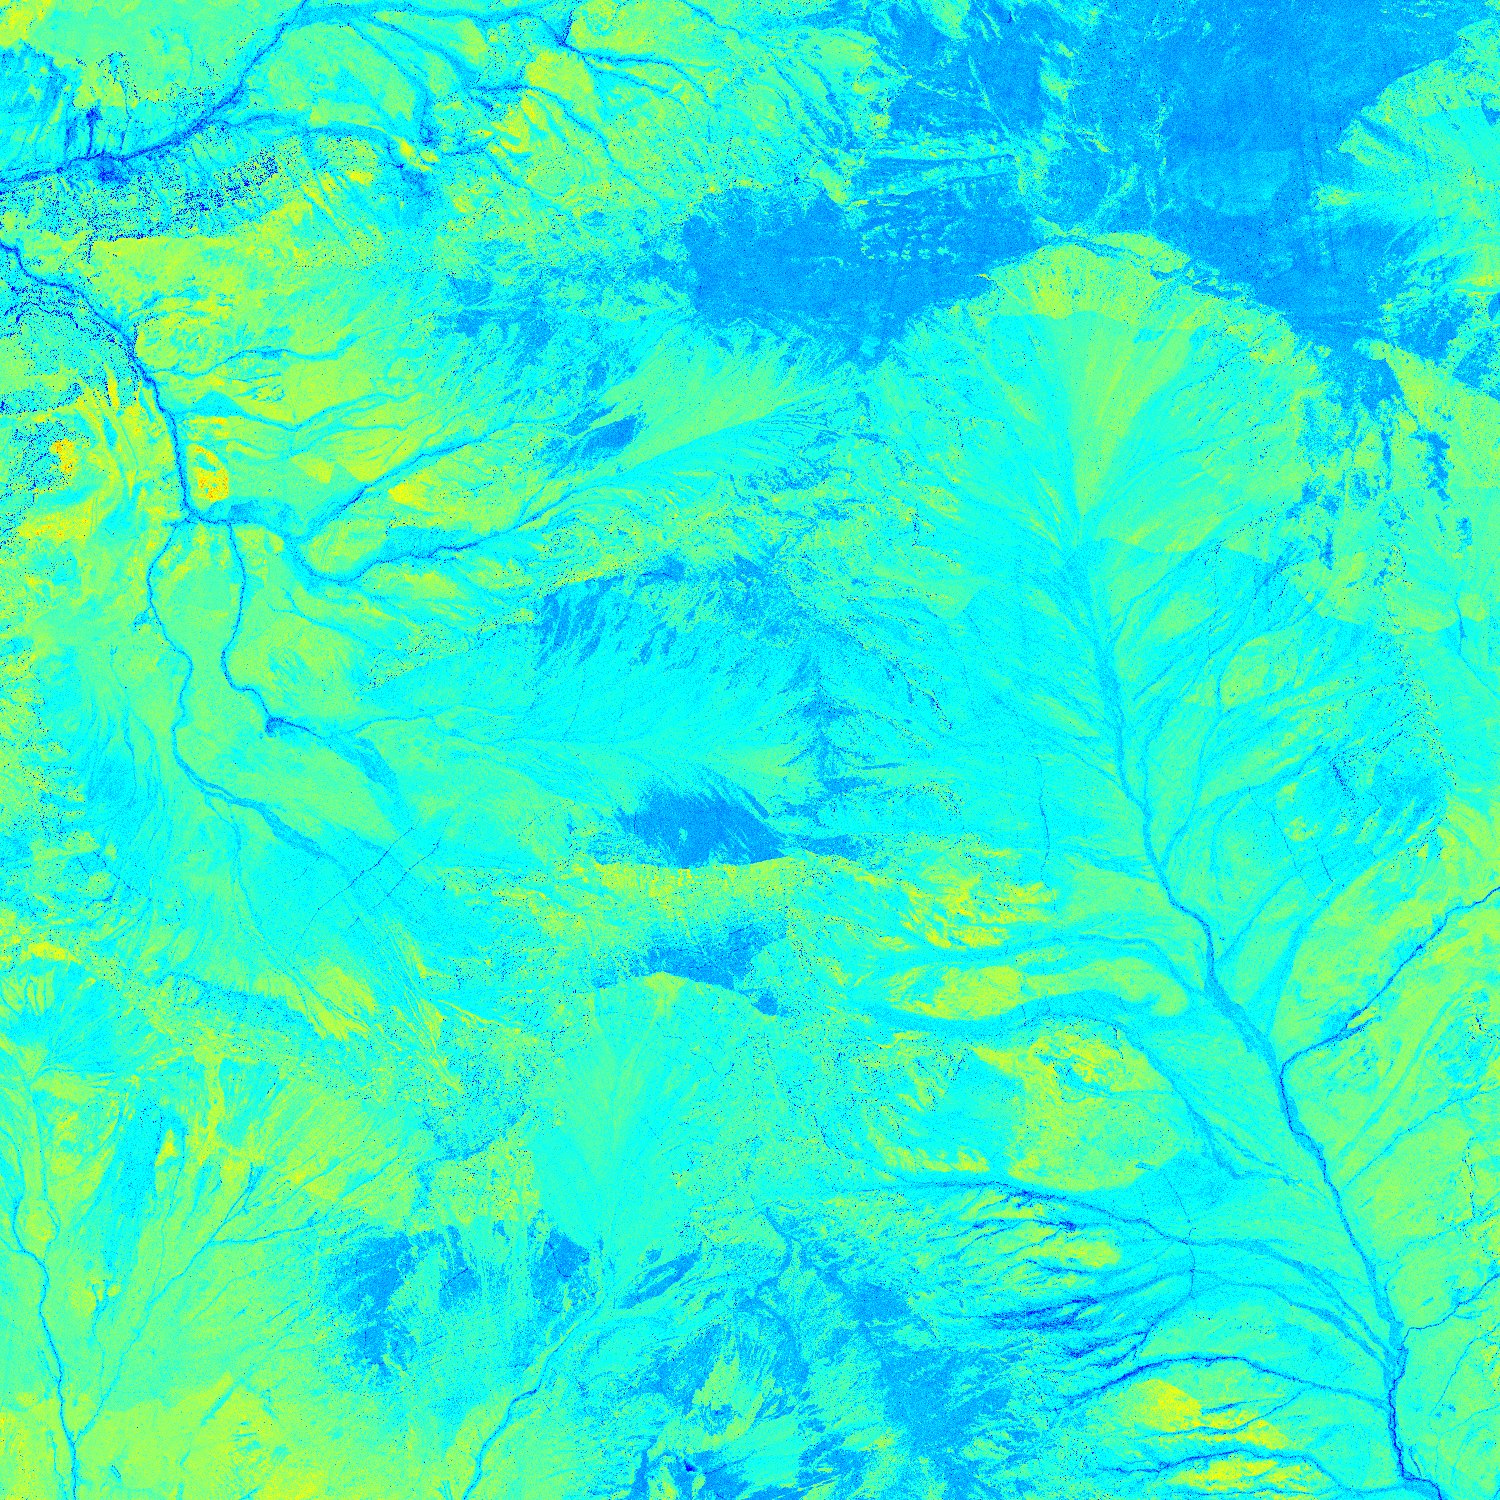
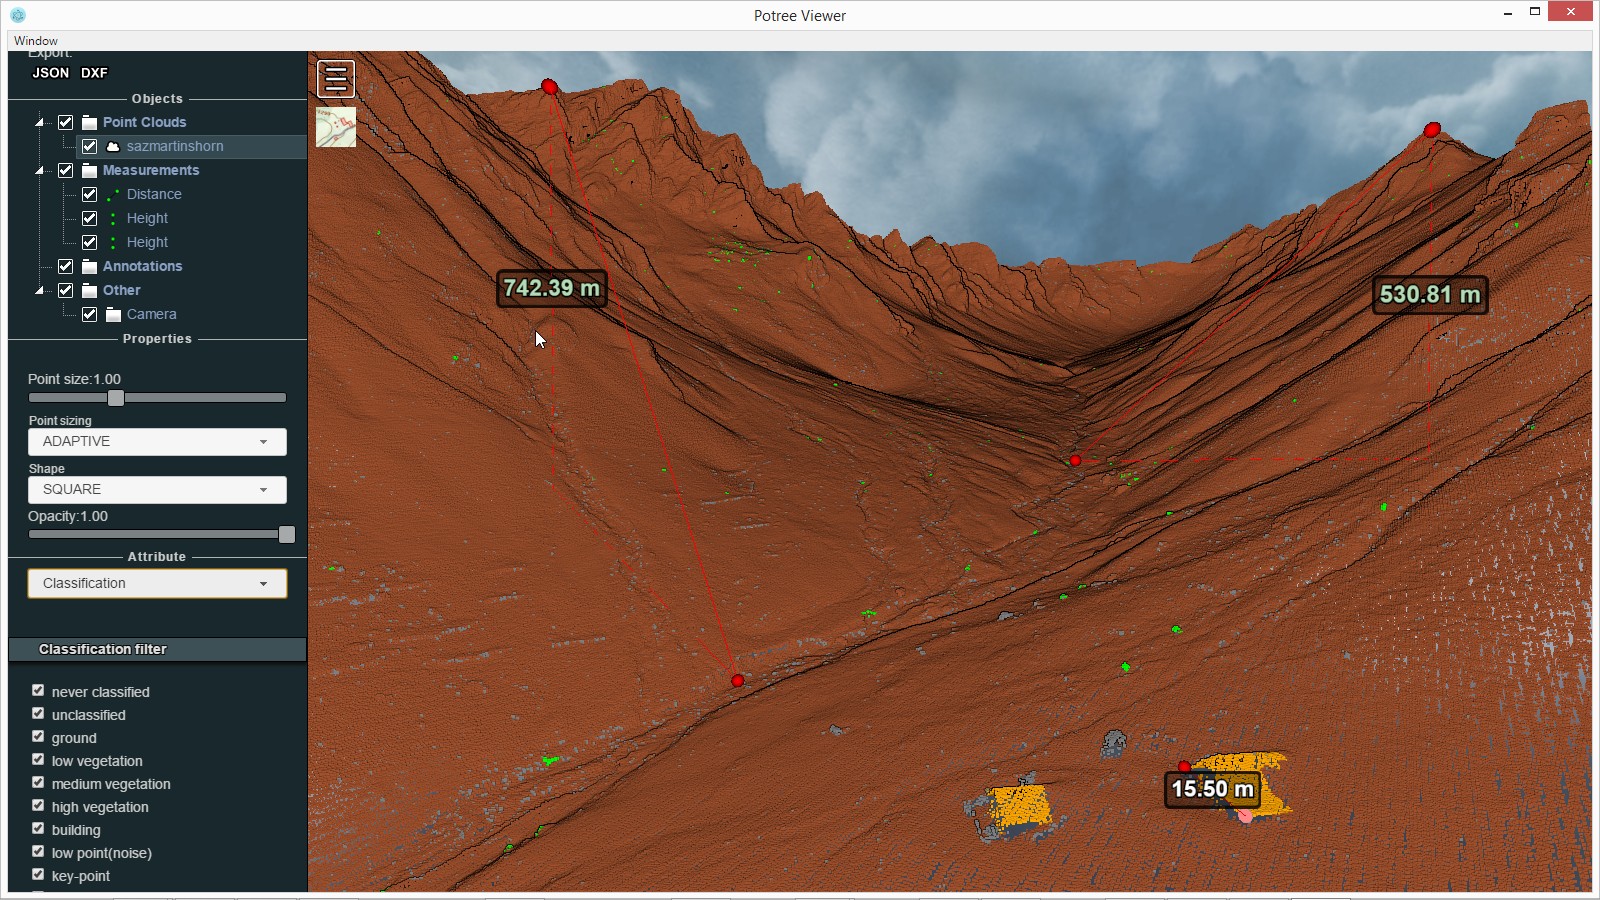
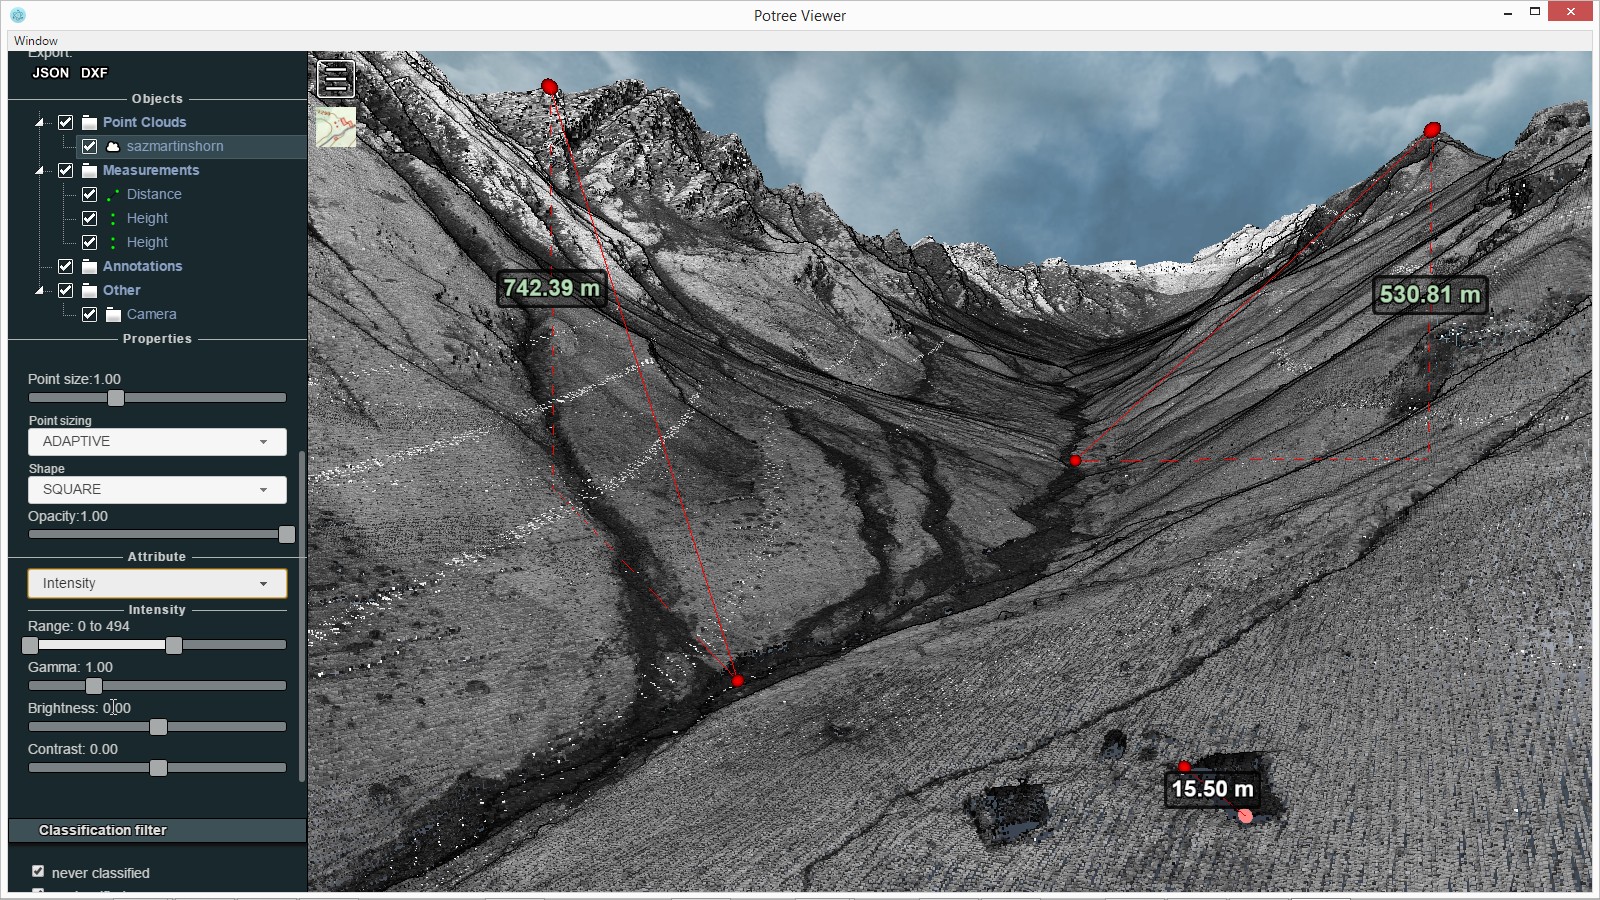
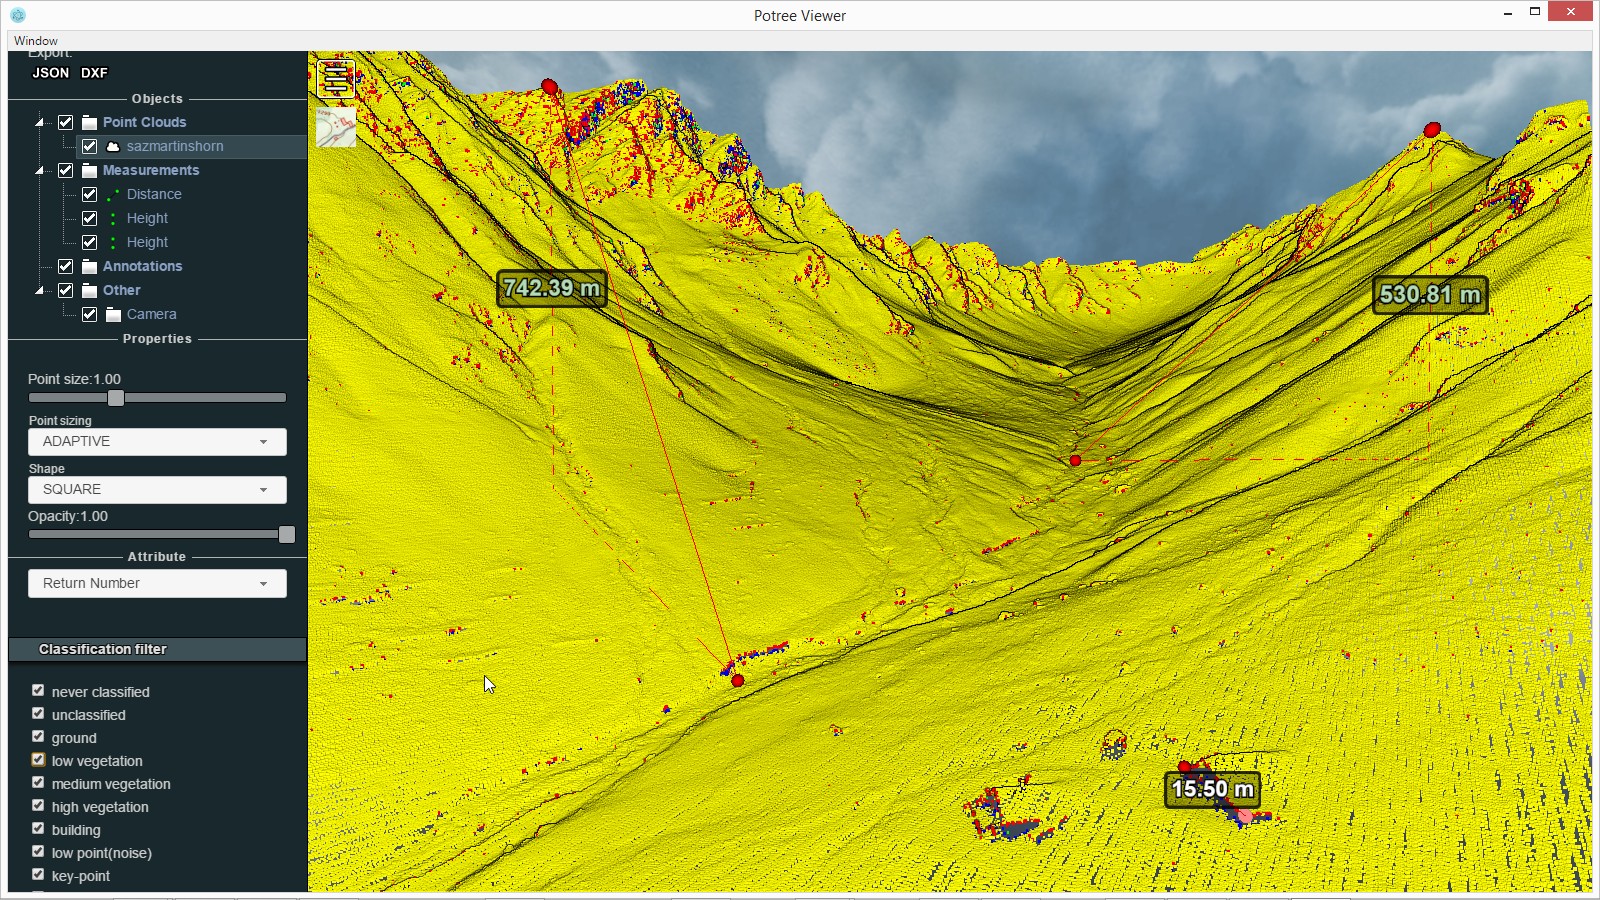
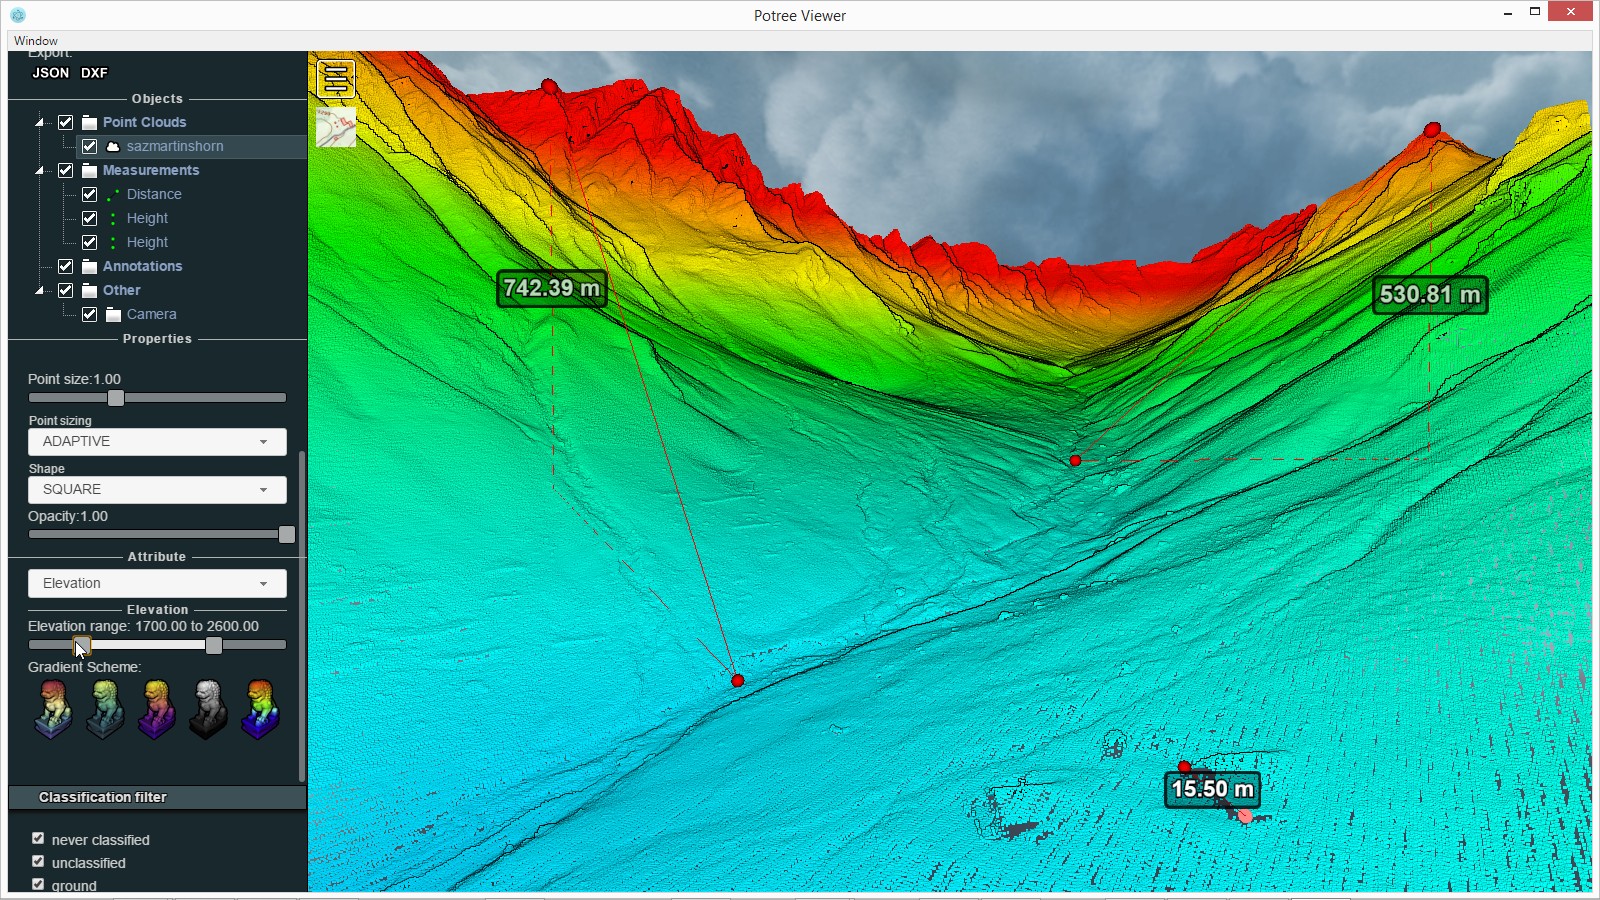
Finally we created a portal with laspublish to visualize the point cloud data interactively with Potree. The four screenshots below highlight only a few of the abilities for visualizing and measuring the point cloud.
laspublish ^
-i swisssurface3d_laz\*.laz ^
-elevation ^
-odir swisssurface3d_portal ^
-title Sazmartinshorn ^
-o sazmartinshorn.html ^
-olaz -overwrite
The open data license can be found here and we are hereby naming the source.



Hi Martin,
I just downloaded the lidar for Zurich, and the latest version of lastools. My command line and the response from las2las are below. Did you have any issues with the files you downloaded?
c:\microdem\lastools\bin\las2las.exe -i C:\Users\pguth\Downloads\zurich_lidar\swisssurface3d_2018_2676-1248_2056_5728.las\2676_1248.las -o C:\Users\pguth\Downloads\zurich_lidar\swisssurface3d_2018_2676-1248_2056_5728.las\2676_1248_utm.las -target_meter -target_utm 32N -epsg 2056
ERROR: unit 9110 not known
ERROR: unit 9110 not known
ERROR: unit 9201 not known
ERROR: unit 9001 not known
get_ProjectedCSTypeGeoKey: look-up for UTM zone 32 and ellipsoid with id 3 not implemented
get_geo_keys_from_projection for generic projection not implemented
Please use the LAStools user forum for questions and include a lasinfo report.
http://groups.google.com/d/forum/lastools
http://rapidlasso.com/lasinfo