Small to medium sized LiDAR data sets can easily be published online for exploration and download with laspublish of LAStools, which is an easy-to-use wrapper around the powerful Potree open source software for which rapidlasso GmbH has been a major sponsor. During a workshop on LiDAR processing at CICESE in Ensenada, Mexico we learned that Guadalajara – the city with five „a“ in its name – has recently published its LiDAR holdings online for download using an interactive 3D portal based on Potree.


There is a lot more data available in Mexico but only Guadalajara seems to have an interactive download portal at the moment with open LiDAR. Have a look at the map below to get an idea of the LiDAR holdings that are held in the archives of the Instituto Nacional de Estadística y Geografía (INEGI). You can request this data either by filling out this form or by sending an email to atencion.usuarios@inegi.org.mx. You will need to explain the use of the information, but apparently INEGI has a fast response time. I was given the KML files you see below and told that each letter in scale 1: 50,000 is divided into 6 regions (a-f) and each region subdivided into 4 parts. Contact me if you want the KML files or if you can provide further clarification on this indexing scheme and/or the data license.

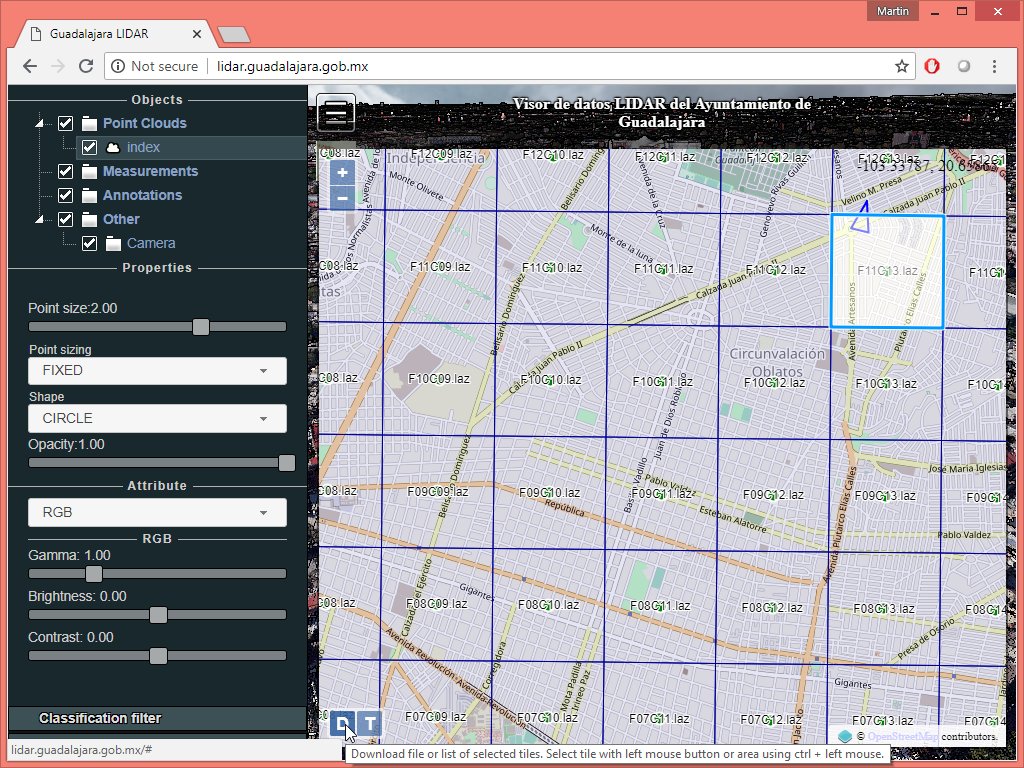
But back to Guadalajara’s open LiDAR. The tile names become visible when you zoom in closer on the map with the tiling overlay as seen below. An individual tile can easily be downloaded by first clicking so that it becomes highlighted and then pressing the „D“ button in the lower left corner. We download the two tiles called ‚F08C04.laz‘ and ‚F08C05.laz‘ and use lasinfo to determine that their average density is 9.0 and 8.9 last returns per per square meter. This means on average 9 laser pulses were fired at each square meter in those two tiles.
lasinfo -i F08C04.laz -cd
lasinfo -i F08C05.laz -cd
The minimal quality check that we recommend doing for any newly obtained LiDAR data is to verify proper alignment of the flightlines using lasoverlap. For tiles with properly populated ‚point source ID‘ fields this can be done using the command line shown below.
lasoverlap -i F08C04.laz F08C05.laz ^
           -min_diff 0.1 -max_diff 0.3 ^
           -odir quality -opng ^
           -cores 2
We notice some slight miss-alignments in the difference image (see other tutorials such as this one for how to interpret the resulting color images). We suggest you follow the steps done there to take a closer look at some of the larger strip-like areas that exhibit some systematic disscolorization (compared to other areas) into overly blueish or reddish tones of with lasview. Overlaying one of the resulting *_diff.png files in the GUI of LAStools makes it easy to pick a suspicious area.

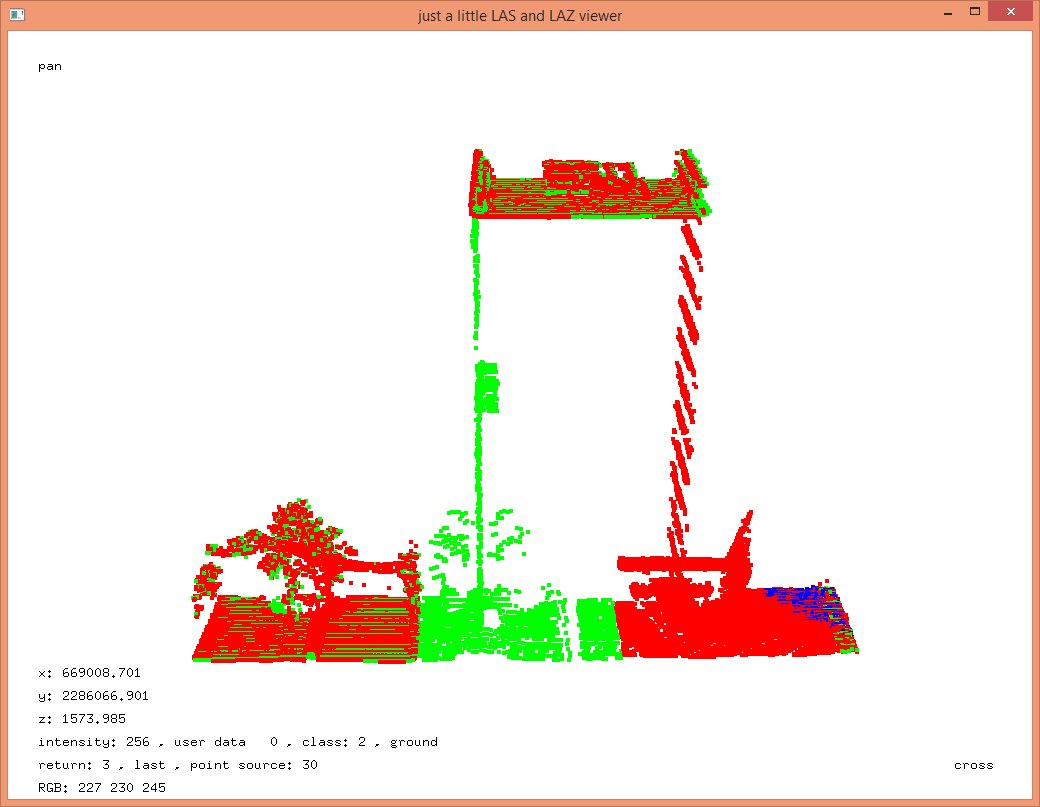
Unusual are also the large red and blue areas where some of the taller buildings are. Usually those are just one pixel wide which has to do with the laser of one flightline not being able to see the lower area seen by the laser of the other flightline because the line-of-sight is blocked by the structure. We have a closer look at one of these unusual building colorization by picking the building shown above and viewing it with the different visualization options that are shown in the images below.


No. Those are not the „James Bond movie“ kind of lasers that burn holes into the building to get ground returns through several floors. The building facade is covered with glass so that the lasers do not scatter photons when they hit the side of the building. Instead they reflect by the usual rule „incidence angle equals reflection angle“ of perfectly specular surfaces and eventually hit the ground next to the building. Some of the photons travel back the same way to the receiver on the plane where they get registered as returns. The LiDAR system has no way to know that the photons did not travel the usual straight path. It only measures the time until the photons return and generates a return at the range corresponding to this time along the direction vector that this laser shot was fired at. If the specular reflection of the photons hits a truck or a tree situated next to to building, then we should find that truck or that tree – mirrored by the glossy surface of the building – on the inside of the building. If you look careful at the „slice“ through the building below you may find an example … (-:
Kudos to the City of Guadalajara for becoming – to my knowledge – the first city in Latin America to both open its entire LiDAR holdings and also making it available for download in form of a nice and functional interactive 3D portal.
Pingback: Coco Loco for LiDAR: Open Data and 3D GIS Carnival Cruise into Sao Paulo | rapidlasso GmbH