Recently we saw an interesting LiDAR data set talked about on social media by Chad Netto from Chustz Surveying in New Roads, Louisiana and asked for a copy. It is a LiDAR scan of a sugarcane plantation in Assumption Parish, Louisiana carried out with the VUX-1UAV by RIEGL mounted onto a RiCOPTER and guided by an Applanix IMU and a Trimble base station. That is probably one of the sweetest (but also one of the most expensive) UAV LiDAR system you can buy today. I received this LiDAR file and this trajectory file. In the following we talk a detailed look at this data set.
First we run lasinfo to get an idea of the contents of the data set. We create various histograms as those can often help understand an unfamiliar data set:
lasinfo -i sugarcane\181026_163424.laz ^
        -cd ^
        -histo gps_time 5 ^
        -histo intensity 64 ^
        -histo point_source 1 ^
        -histo z 5 ^
        -odix _info -otxt
You can download the resulting report here. For the 84,751,955 points we notice that
- both horizontal and vertical coordinates are stored in US survey feet
- with scale factors of 0.00025 this means a resolution of 76 micrometer
- there is no explicit flight line information (all point source IDs are zero)
- gaps in the GPS time stamp histogram are suggesting multiple lines
First we use las2las to lower the insanely high resolution from 0.00025 US survey feet to something more reasonable for an airborne UAV scan, namely to 0.01 or 1 hundredths of a US survey foot or centi-US-survey-feet:
las2las -i sugarcane\181026_163424.laz ^
        -rescale 0.01 0.01 0.01 ^
        -odix _cft -olaz
I have already done this for you. The file that is online is already in „centi-US-survey-feet“ because it reduced the file size from the original 678 MB file that we got from Netto to the 518 MB file that is online, meaning that you had 160 MB less data to download.
Next we use lassplit to recover the original flight lines as follows:
lassplit -i sugarcane\181026_163424.laz ^
         -recover_flightlines ^
         -odir sugarcane\0_recovered_strips ^
         -o assumption.laz
This results in 5 strips. We then use lassort to bring the strips back into their original acquisition order by sorting first based on the GPS time stamp (which brings all returns of one pulse together) and second on the return number (which sorts them in ascending order). We do this on 3 cores in parallel with this command:
lassort -i sugarcane\0_recovered_strips\*.laz ^
        -gps_time ^
        -return_number ^
        -odir sugarcane\1_sorted_strips -olaz ^
        -cores 3
We also create a spatial index for each of these strips using lasindex so that any area-of-interest query that we do later will be significantly accelerated. See the README file for the meaning of the parameters:
lasindex -i sugarcane\1_sorted_strips\*.laz ^
         -tile_size 10 -maximum -100 ^
         -cores 3
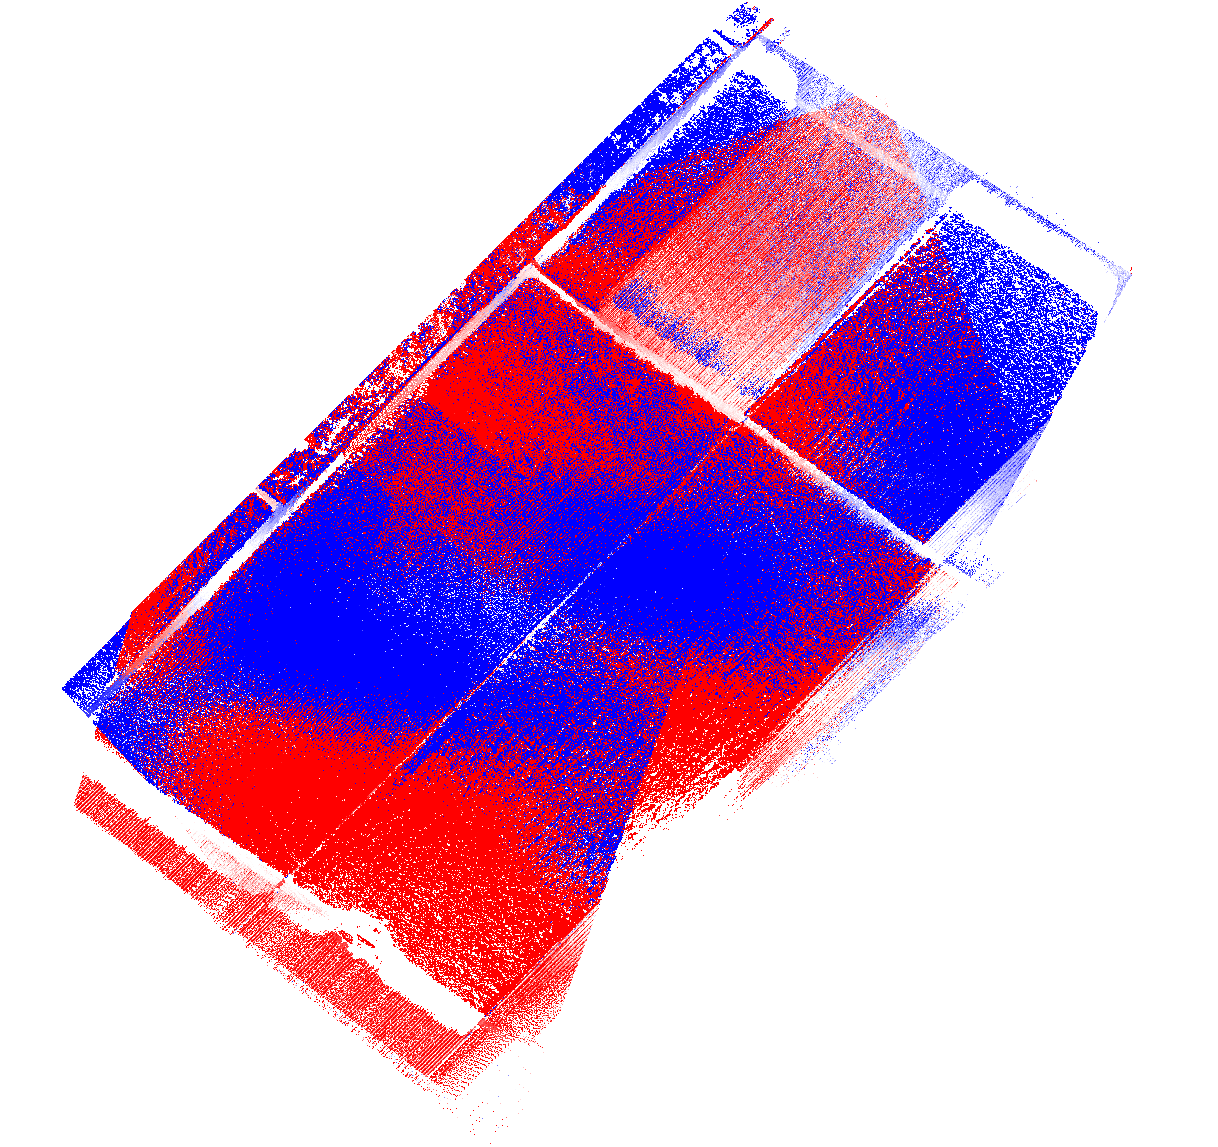
Then we check for flight line alignment using lasoverlap by comparing – per 2 feet by 2 feet area – the lowest elevation value of points from different strips wherever there is overlap. Cells with an absolute vertical difference of less than a quarter of a foot are mapped to white. Cells with vertical differences of more (or less) than a quarter foot are mapped to an increasingly red (or blue) color that is saturated red (or blue) when one full foot is reached.
lasoverlap -i sugarcane\1_sorted_strips\*.laz ^
           -files_are_flightlines ^
           -step 2.0 ^
           -min_diff 0.25 -max_diff 1.0 ^
           -o sugarcane\2_quality\overlap.png
The resulting image looks dramatic at first glance. But we have to remember that this is sugarcane. The penetration of the laser can vary greatly depending on the direction from which the beam hits the densely standing stalks. Large differences between flight lines can be expected where sugarcane stands tall. We need to focus our visual quality checks on the few open areas, namely the access roads and harvested areas.
We use las2las via its native GUI to cut out several suspicious-looking open areas with overly red or overly blue shading. By loading the resulting image into the GUI these areas-of-interest are easy to target and cut out.
las2las -i sugarcane\1_sorted_strips\*.laz -gui
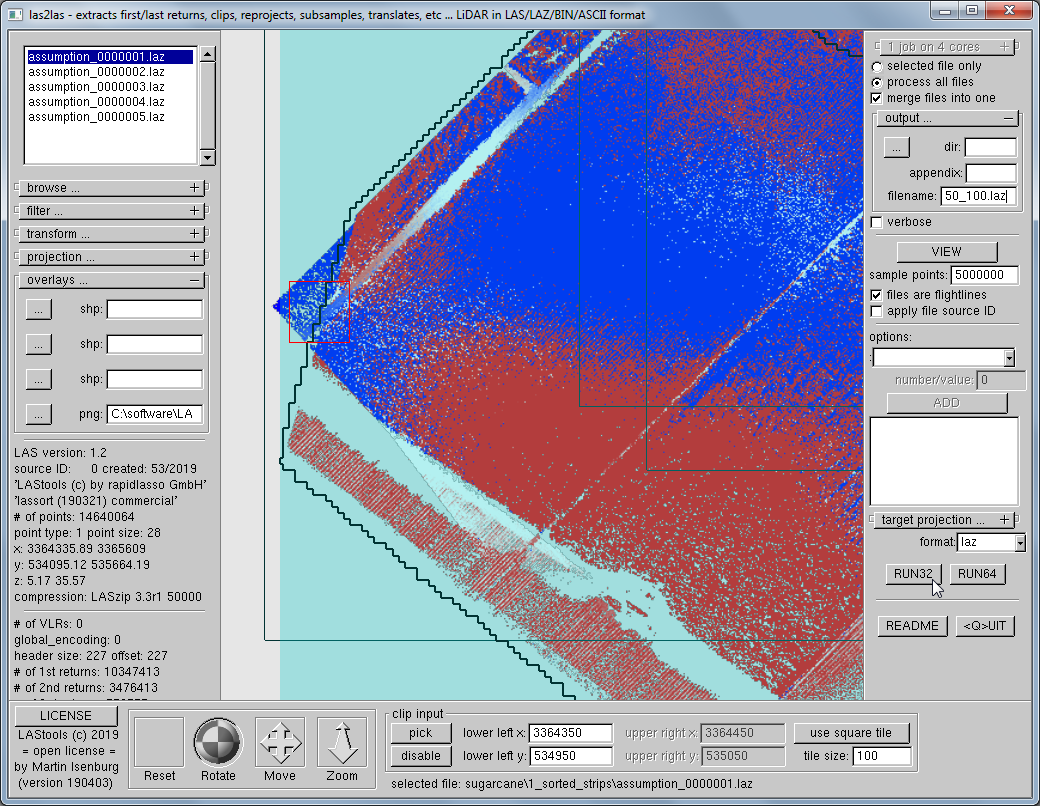
We cut out four square 100 by 100 meter tiles in open areas that show a suspiciously strong pattern of red or blue colors for closer inspection. The command lines for these four square areas are given below and you can download them here:
- assumption_3364350_534950_100.laz
- assumption_3365600_535750_100.laz
- assumption_3364900_535500_100.laz
- assumption_3365500_535600_100.laz
las2las -i sugarcane\1_sorted_strips\*.laz ^
        -merged -faf ^
        -inside_tile 3364350 534950 100 ^
        -o sugarcane\assumption_3364350_534950_100.laz

las2las -i sugarcane\1_sorted_strips\*.laz ^
        -merged -faf ^
        -inside_tile 3365600 535750 100 ^
        -o sugarcane\assumption_3365600_535750_100.laz

las2las -i sugarcane\1_sorted_strips\*.laz ^
        -merged -faf ^
        -inside_tile 3364900 535500 100 ^
        -o sugarcane\assumption_3364900_535500_100.laz

las2las -i sugarcane\1_sorted_strips\*.laz ^
        -merged -faf ^
        -inside_tile 3365500 535600 100 ^
        -o sugarcane\assumption_3365500_535600_100.laz
In the image sequence below we scrutinize these differences which will lead us to notice two things:
- There are vertical miss-alignments of around one foot. These big difference can especially be observed between flight lines that cover an area with a very high point density and those that cover the very same area with a very low point density.
- There are horizontal miss-alignments of around one foot. Again these differences seem somewhat correlated to the density that these flight lines cover a particular area with.
For the most part the miss-aligned points come from a flight line that has only sparse coverage in that area. In a flat terrain the return density per area goes down the farther we are from the drone as those areas are only reached with higher and higher scan angles. Hence an immediate idea that comes to mind is to limit the scan angle to those closer to nadir and lower the range from -81 to 84 degrees reported in the lasinfo report to something like -75 to 75, -70 to 70, or -65 to 65 degrees. We can check how this will improve the alignment with these lasoverlap command lines:
lasoverlap -i sugarcane\1_sorted_strips\*.laz ^
           -files_are_flightlines ^
           -keep_scan_angle -75 75 ^
           -step 2.0 ^
           -min_diff 0.25 -max_diff 1.0 ^
           -o sugarcane\2_quality\overlap75.png

lasoverlap -i sugarcane\1_sorted_strips\*.laz ^
           -files_are_flightlines ^
           -keep_scan_angle -70 70 ^
           -step 2.0 ^
           -min_diff 0.25 -max_diff 1.0 ^
           -o sugarcane\2_quality\overlap70.png

lasoverlap -i sugarcane\1_sorted_strips\*.laz ^
           -files_are_flightlines ^
           -keep_scan_angle -65 65 ^
           -step 2.0 ^
           -min_diff 0.25 -max_diff 1.0 ^
           -o sugarcane\2_quality\overlap65.png

lasoverlap -i sugarcane\1_sorted_strips\*.laz ^
           -files_are_flightlines ^
           -keep_scan_angle -60 60 ^
           -step 2.0 ^
           -min_diff 0.25 -max_diff 1.0 ^
           -o sugarcane\2_quality\overlap60.png
This simple technique significantly improves the difference image. Based on these images would suggest to only use returns with a scan angle between -70 and 70 degrees for any subsequent analysis. This seems to remove most of the discoloring in open areas without loosing too many points. Note that only using returns with a scan angle between -60 and 60 degrees means that some flight lines are no longer overlapping each other.
Note also that by limiting the scan angle we get suddenly get white areas even in incredible dense vegetation. The more horizontal a laser shoot is the more likely it will only hit higher up sugarcane plants and the less likely it will penetrate all the way to the ground. The white areas coincide with where laser pulses are close to nadir which is in the flight line overlap areas that directly below the drone’s trajectory.
Can we improve alignment further? Not with LAStools, so I turned to Andre Jalobeanu, a specialist on that particular issue, who I have known for many years. Andre has developed BayesStripAlign – a software by his company BayesMap that is quite complementary to LAStools and does exactly what the name suggests: it align strips. I gave Andre the five flight lines and he aligned them for me. Below the new difference images:
We cut out the very same four square areas from the realigned strips for closer inspection and you may investigate them on your own. You can download them here.
- assumption_3364350_534950_100_realigned.laz
- assumption_3365600_535750_100_realigned.laz
- assumption_3364900_535500_100_realigned.laz
- assumption_3365500_535600_100_realigned.laz
In the image sequence below we are just looking at the last of the four square areas and you can see that most of the miss-alignment we saw earlier between the flight lines was removed.
We would like to thank Chad Netto from Chustz Surveying to make this data set available to us and Andre Jalobeanu from BayesMap to align the flight lines for us.
Could you please publish a metric version of this article so the rest of the metric-speaking world can understand. 😉
I do not like the imperial system either. The U.S. survey feet may be converted to meters by multiplying U.S. survey feet by the fraction 1200/3937 or 0.3048006096. However, I did receive the data in U.S. survey foot and I like to present workflows with whatever data a client actually has. Note that most of my blog posts are metric. Do you have a nice UAV LiDAR data set to share that is in meters?